elcome to another crypto market outlook for the 7th of February!
In today's market analysis, we will delve into the current state of the cryptocurrency market. BTC is hovering around the $43,700 mark, and USDT.D has been trading within a narrow range for the past two weeks.
Furthermore, we will cover five altcoins (SKL, RUNE, IOTA, QNT, and MASK), emphasizing their key levels and potential trading setups.
Are you ready?
Today, we will cover the following topics:
- USDT.D and BTC Analysis
- 5 Altcoins Analysis
- Quotes / Advices
- Closing Remarks
USDT.D and BTC analysis
As usual, I always start my analysis with USDT.D as it serves as an indicator of traders' sentiment. USDT.D reflects whether traders are optimistic (investing in cryptocurrencies) or pessimistic (shifting towards stablecoins).
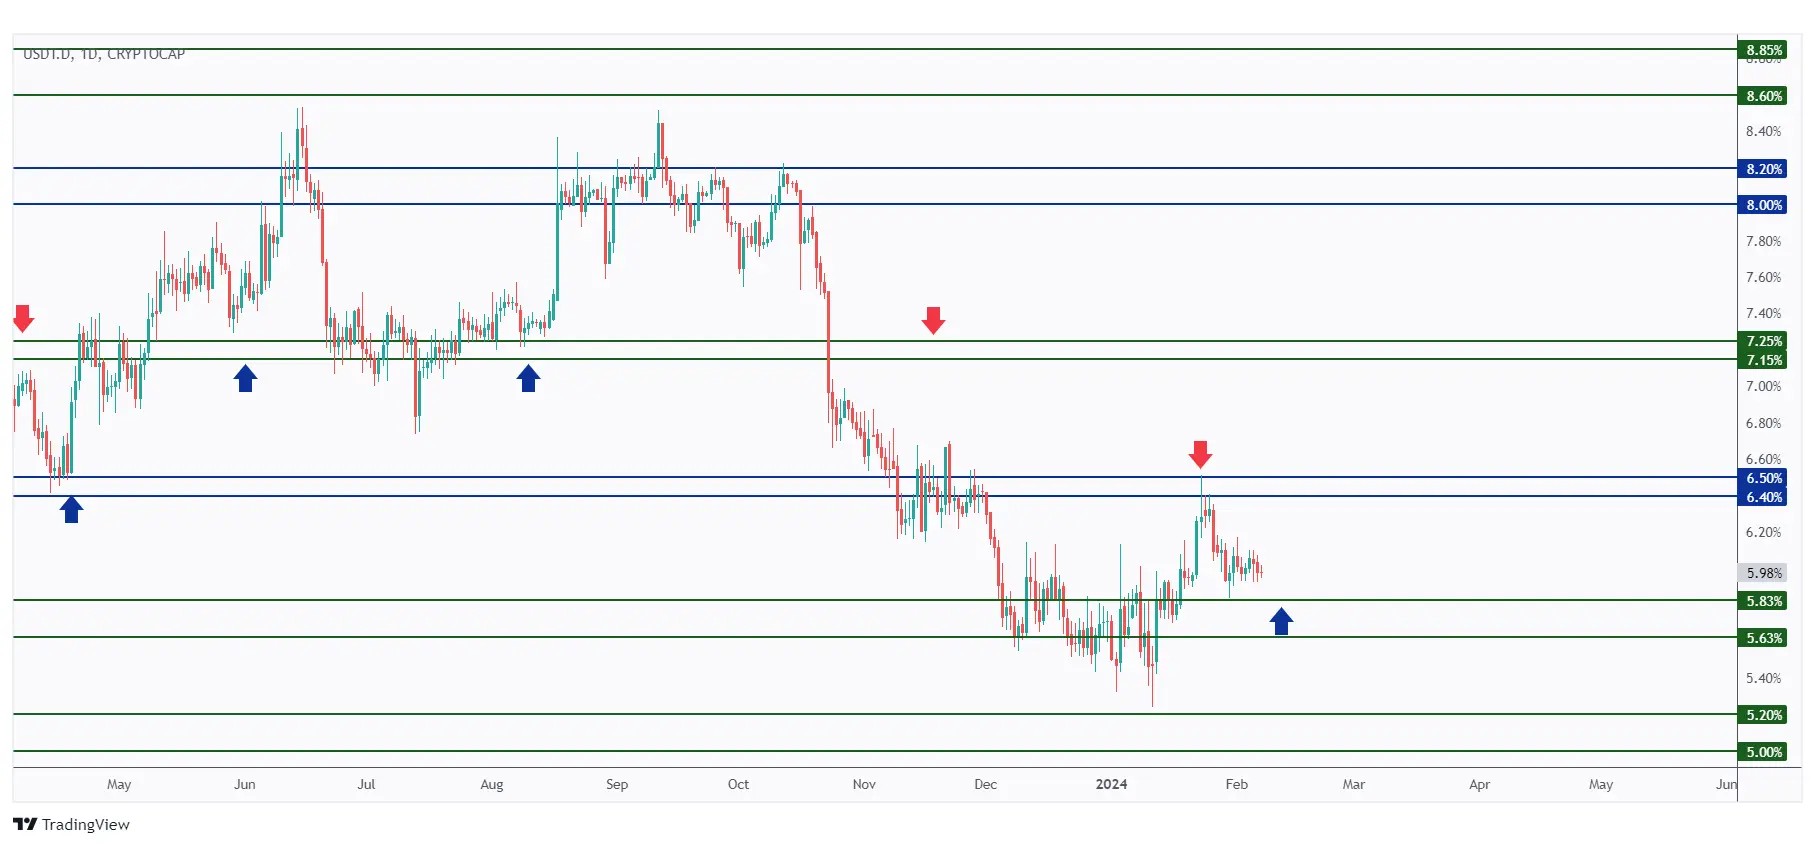
USDT.D has been consolidating within a narrow range around a support zone for nearly two weeks.
As long as the support holds, we anticipate a bullish movement. However, there is still a possibility for USDT.D to test the 5.63% support level before resuming upward movement.
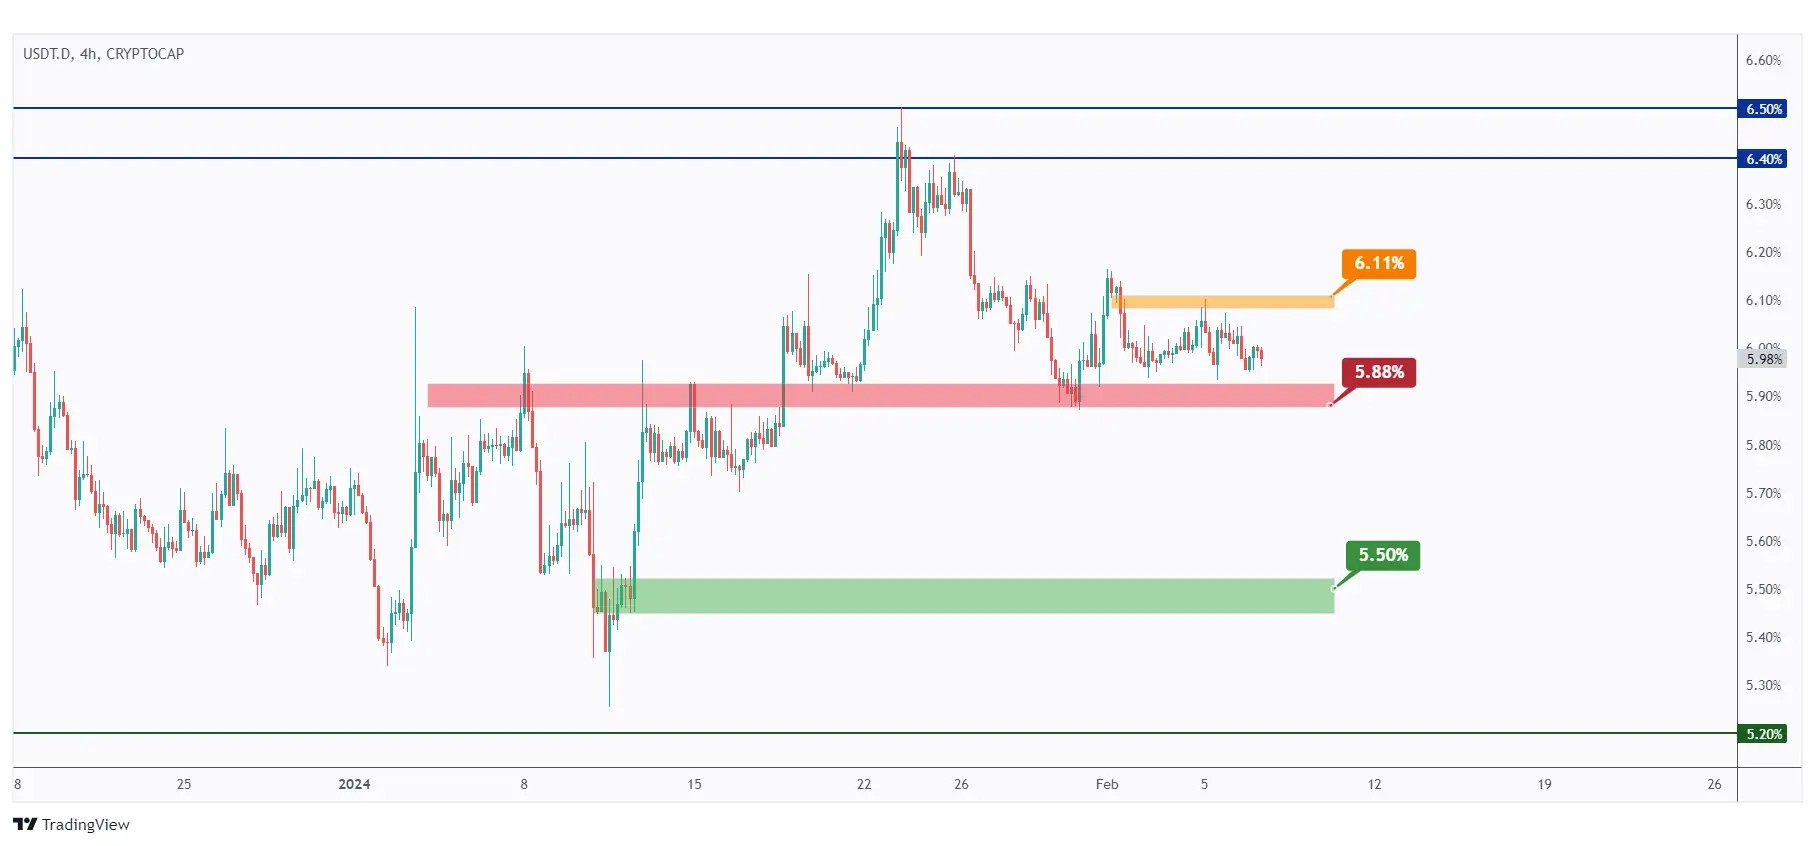
As per our last outlook, USDT.D is still positioned around a major structure at 5.88%. If this structure is breached downward, we anticipate further bearish movement towards the 5.5% demand zone.
In parallel, for the bulls to take over and push the price towards the 6.4% resistance zone, a breakout above the last major high at 6.11% is required.
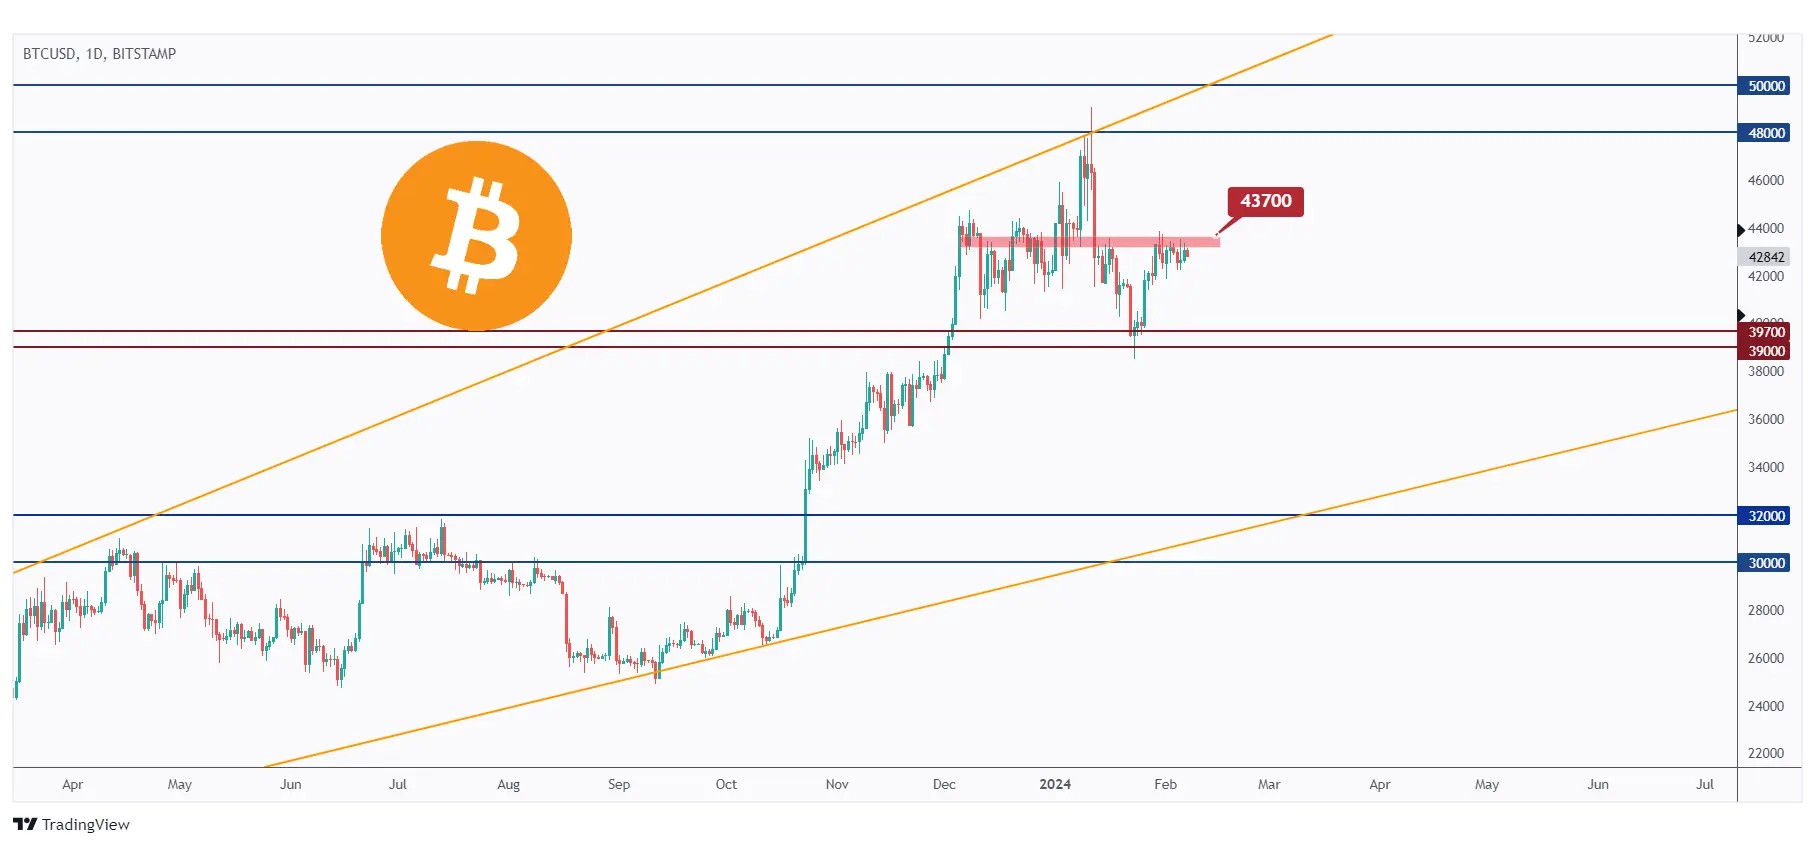
This week has been relatively uneventful as BTC continues to hover around the significant high of $43,700.
To remain in control and push the price towards the $50,000 resistance, a breakout above the $43,700 level is needed.
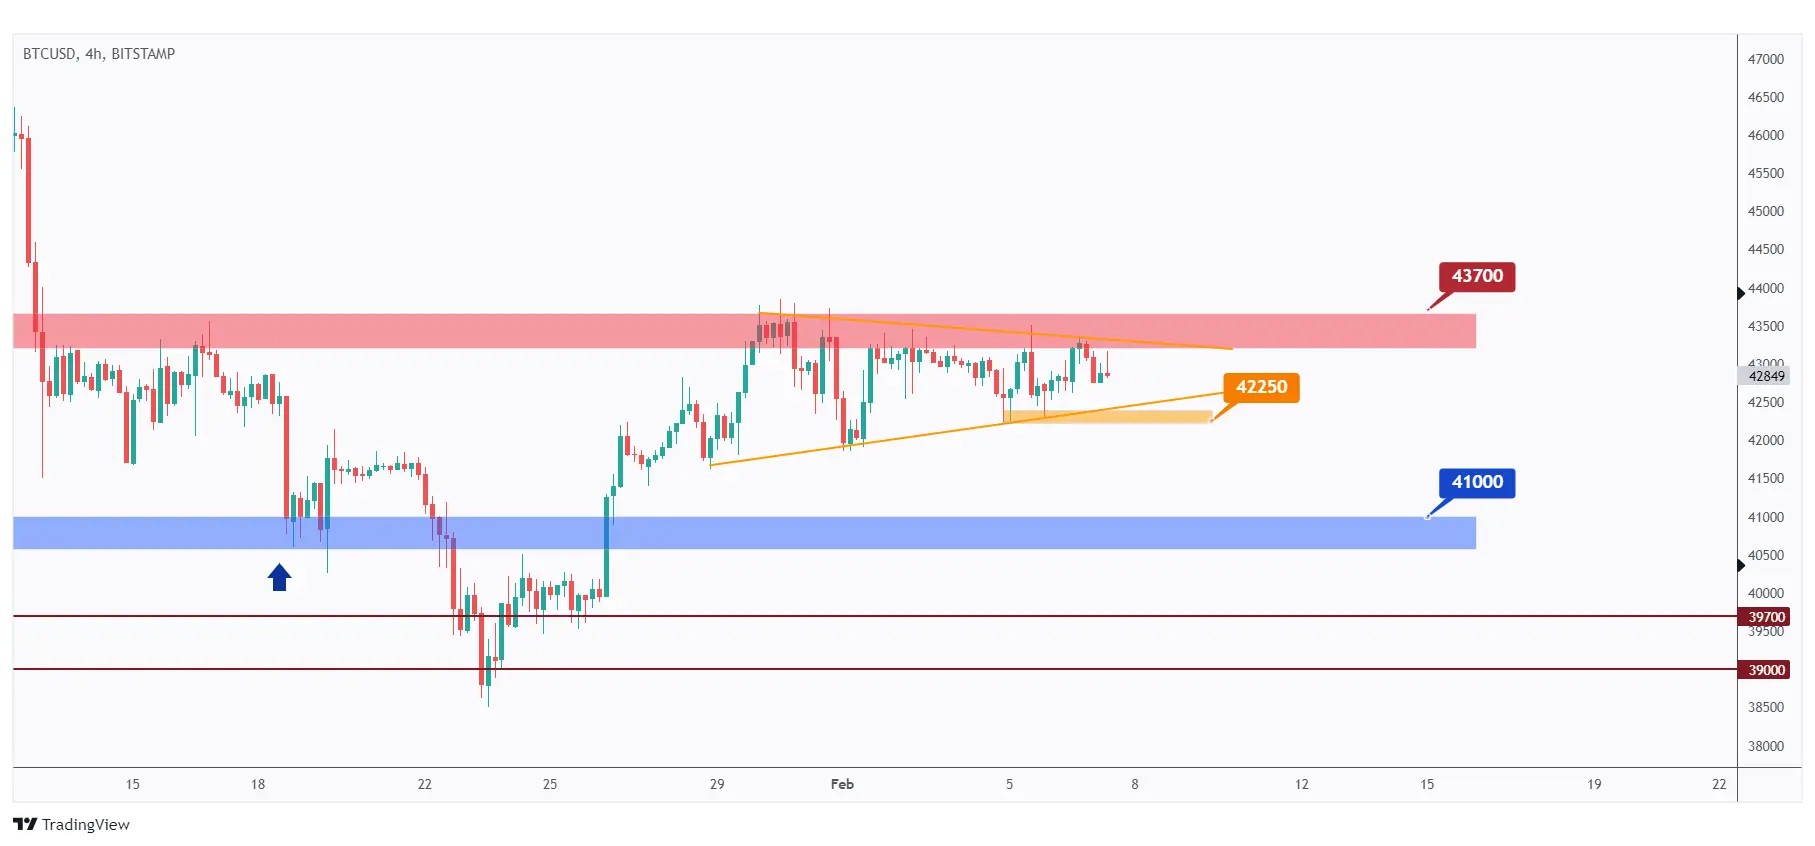
BTC has been trading within a symmetrical triangle pattern highlighted in orange.
Should the last low at $42,250 be breached downward, we anticipate further bearish movement towards the $41,000 support level.
In parallel, if the symmetrical triangle and the $43,700 resistance are broken upward, we expect a bullish continuation towards $48,000.
5 Altcoins Analysis
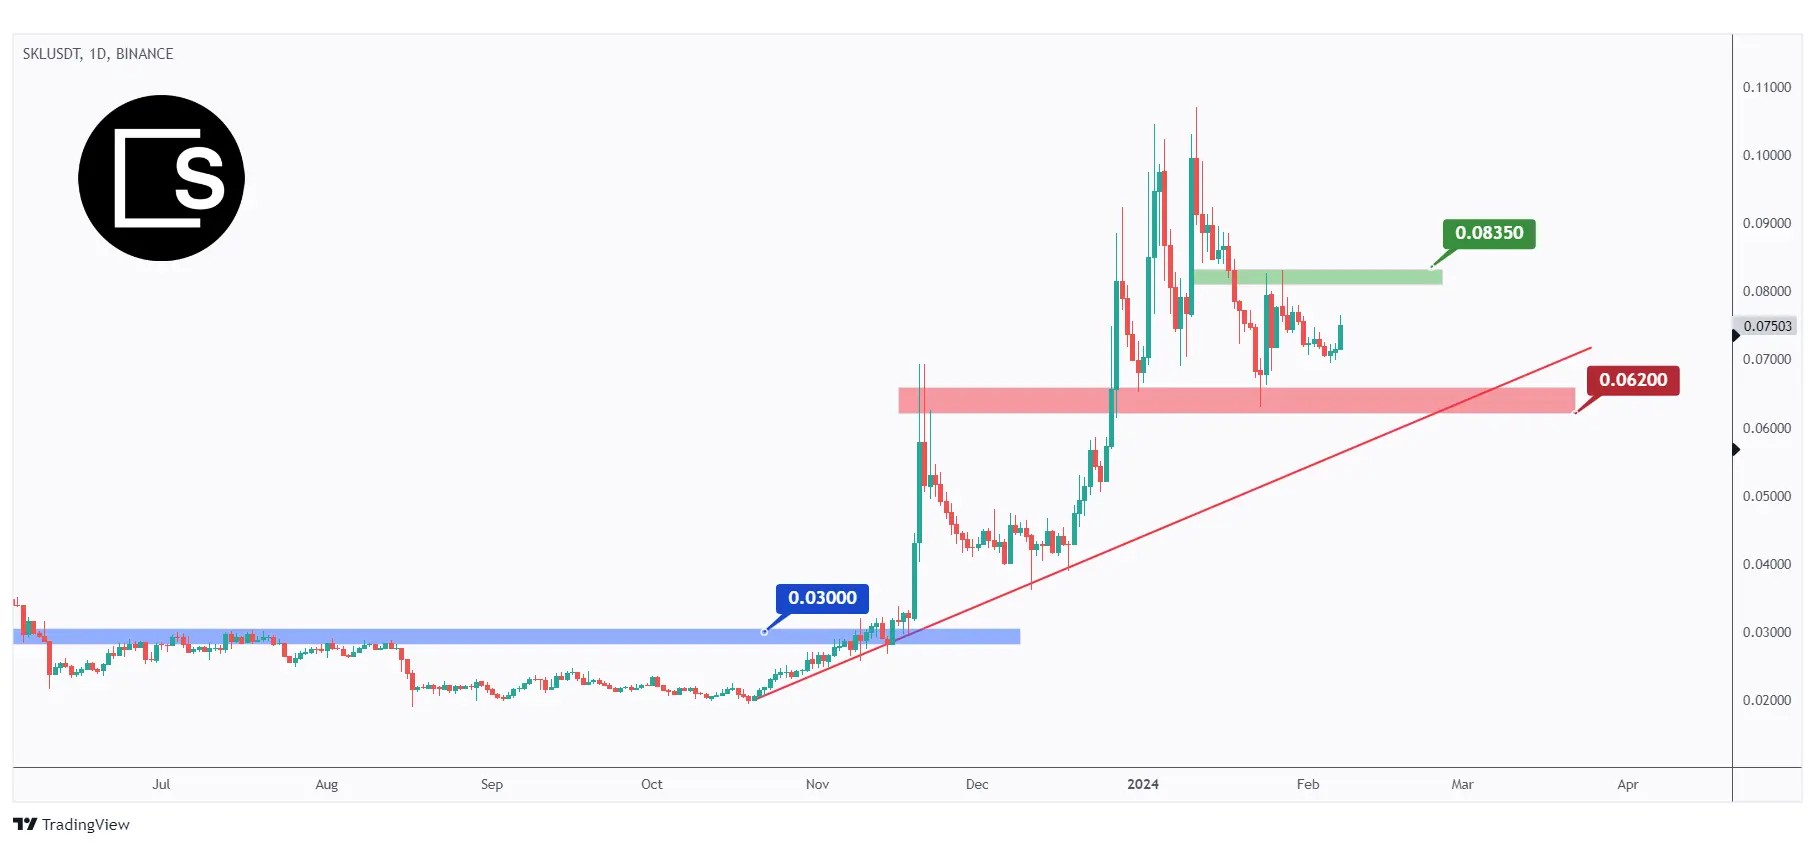
As per our previous analysis from a couple of weeks ago, SKL successfully broke above the $0.03 resistance level and surged to reach our target at $0.1.
At present, SKL is undergoing a correction phase and is approaching the red trendline and the $0.062 support level. Hence we will be looking for trend-following buy setups.
For the bulls to assume control in the medium-term and initiate the next upward impulse movement, a breakout above the last major high at $0.0835, highlighted in green, is needed.
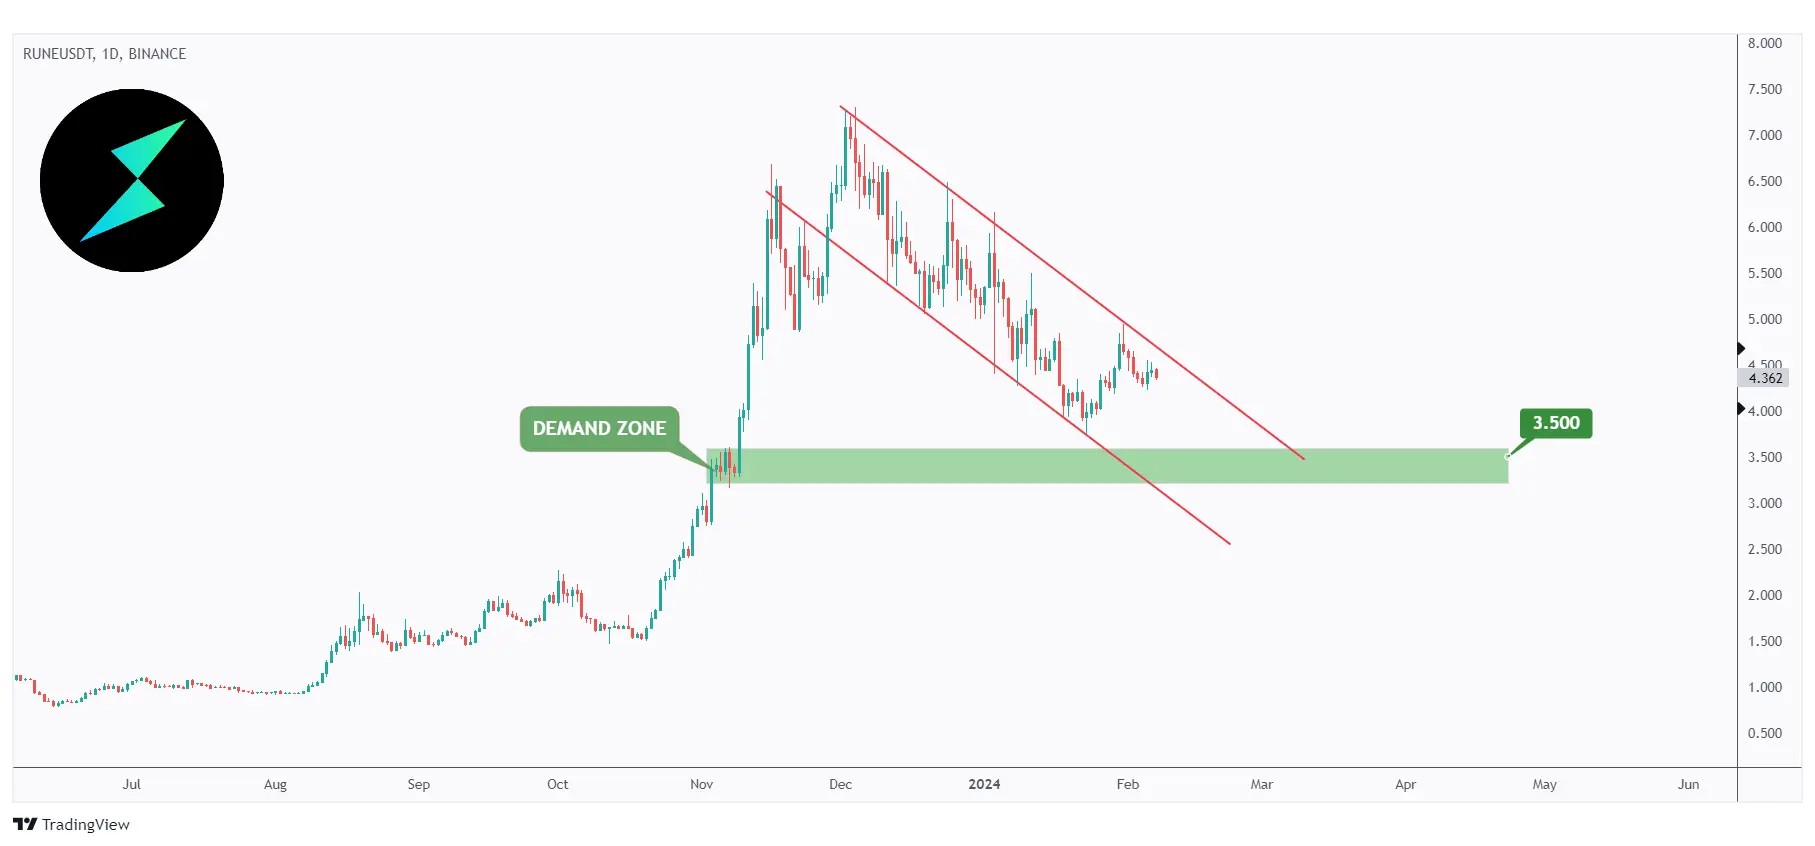
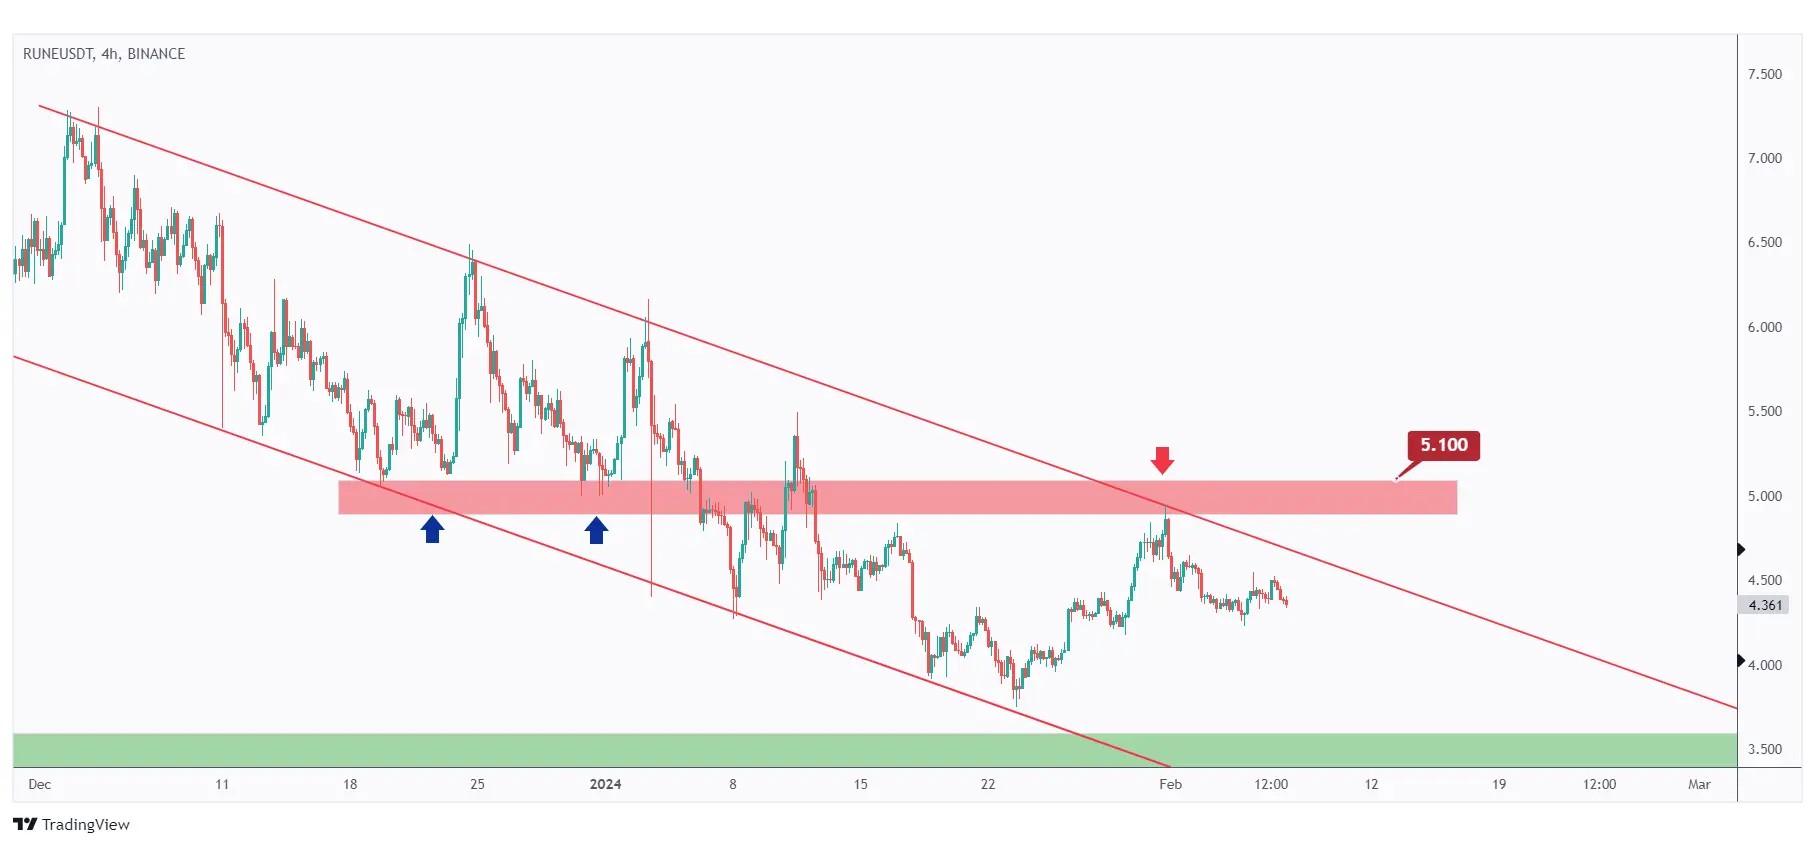
Turning our attention to RUNE, it has been overall bearish, trading within the descending channel outlined in red.
However, it is currently approaching a strong demand zone at $3.5, thus we will be expecting the bulls to kick in anytime soon.
In the 4-hour timeframe, for the bulls to take over and shift the momentum from bearish to bullish , a breakout below the upper red trendline and the last major high at $5.1 is needed.
Meanwhile, RUNE is expected to remain bearish and may continue to decline towards filling the $3.5 daily demand zone.
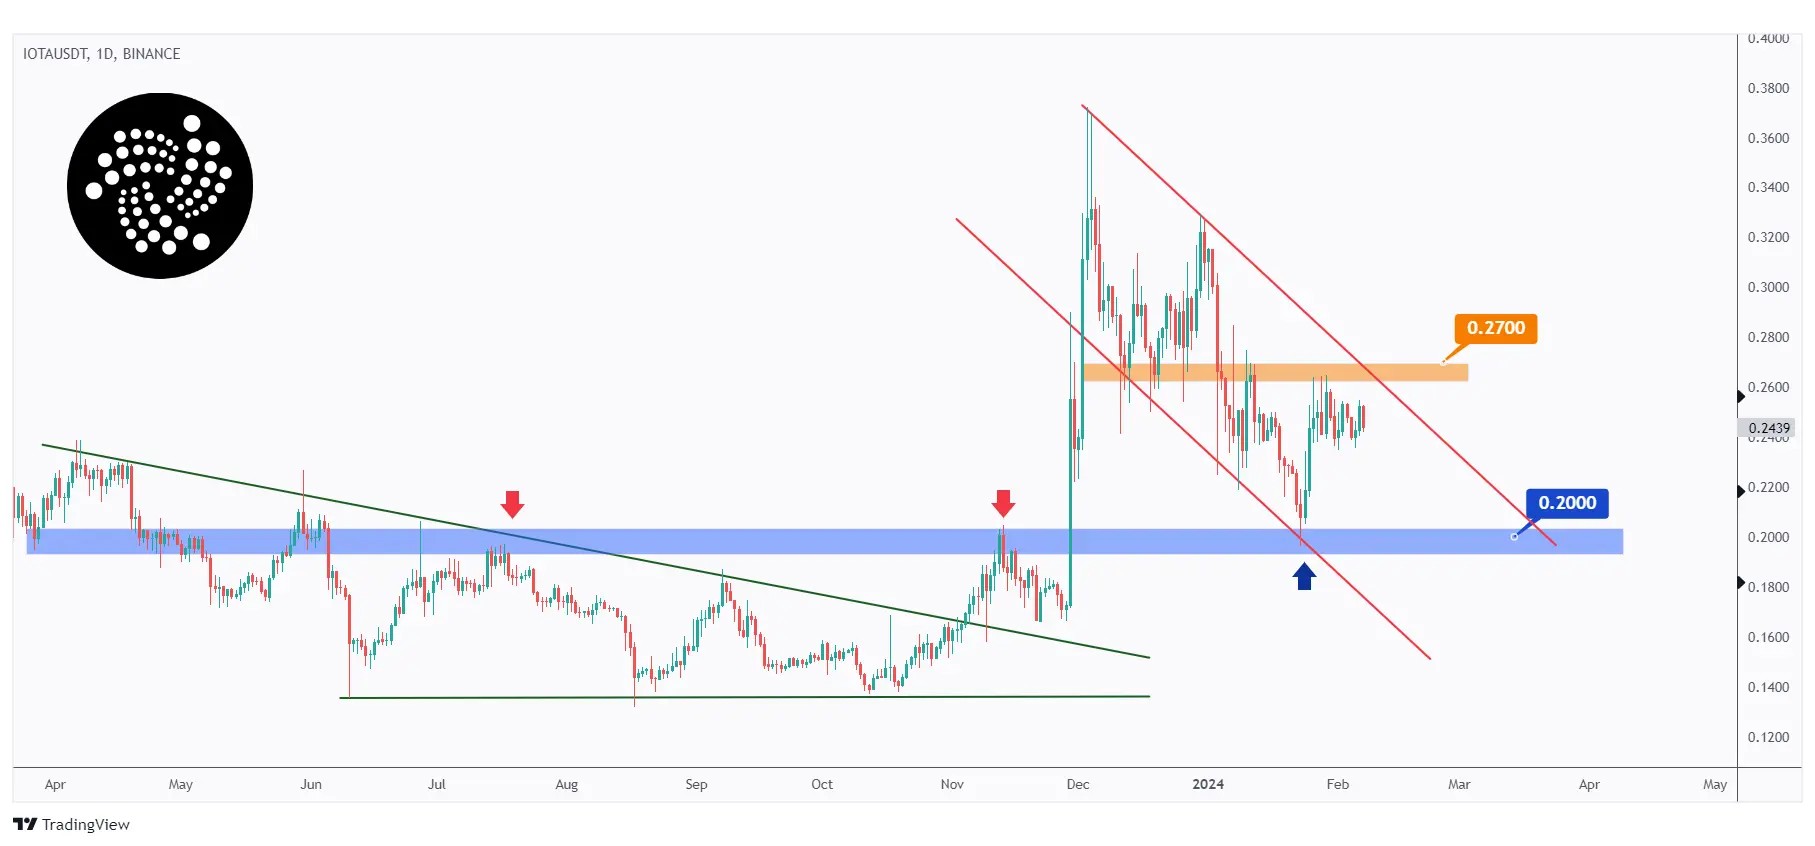
Next on the list for today is IOTA. It is currently bearish, trading within the descending channel in red.
For the bulls to assume control and initiate the next upward impulse, a breakout above the last major high highlighted in orange at $0.27 is required.
Meanwhile, IOTA may continue to trade lower to test the $0.2 support level. In this scenario, we will be looking for new short-term buy setups on lower timeframes.
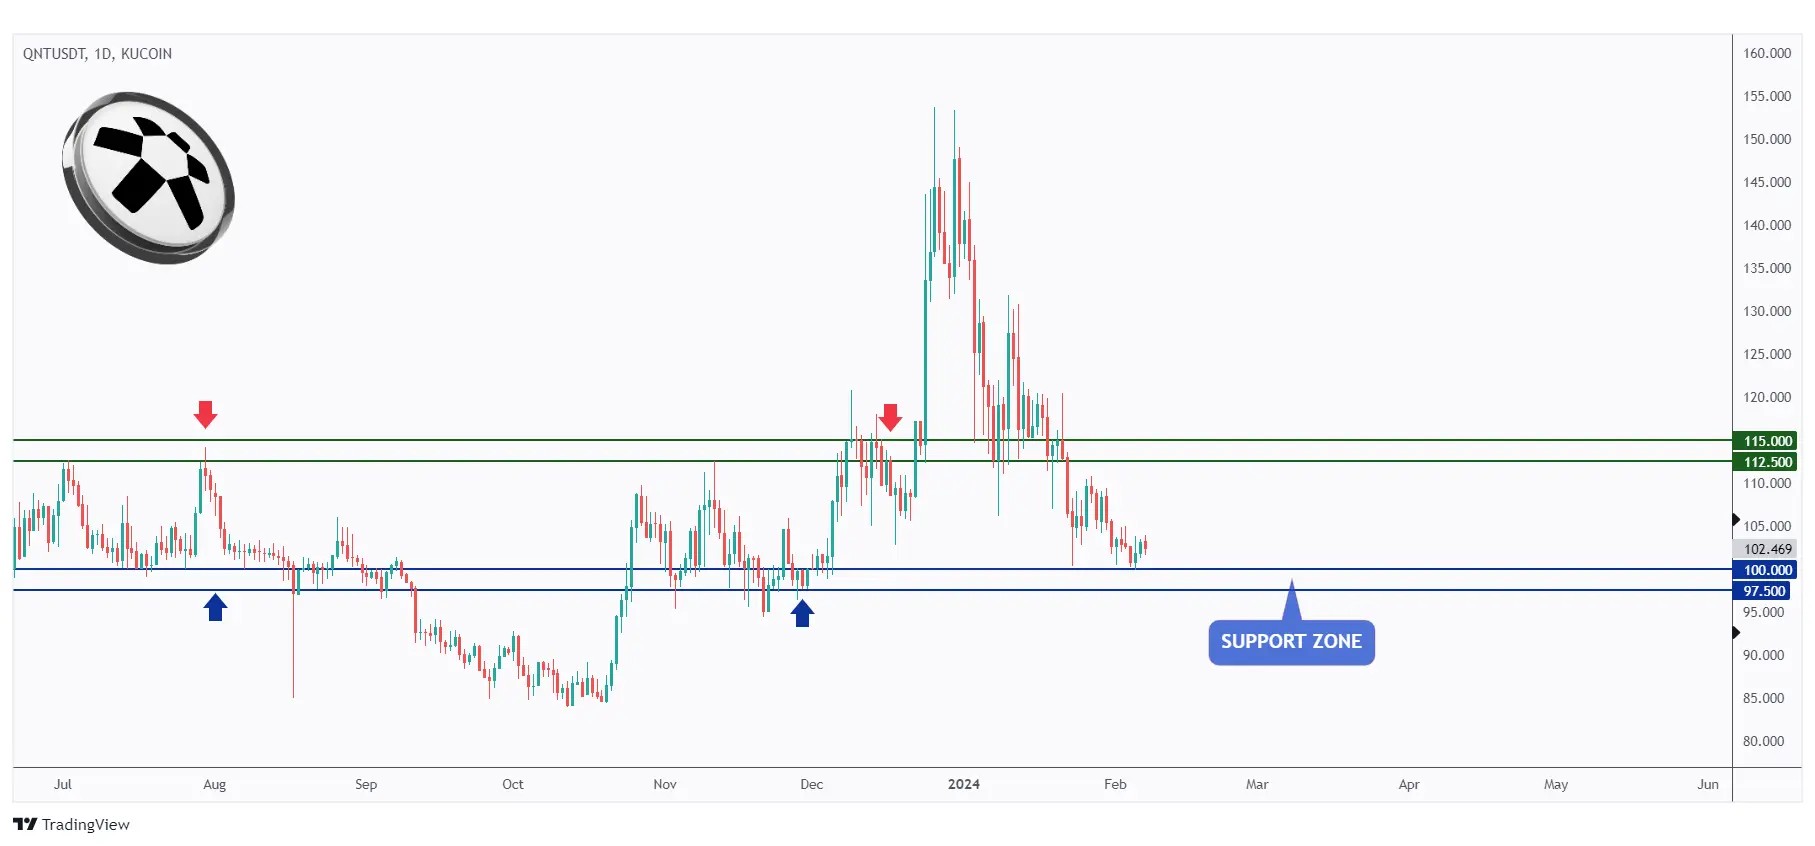
Analyzing QNT, it has been hovering within a range bounded by the $100 support and the $115 resistance.
Currently, QNT is approaching the lower bound of the range so we will be looking for buy setups on lower timeframes.
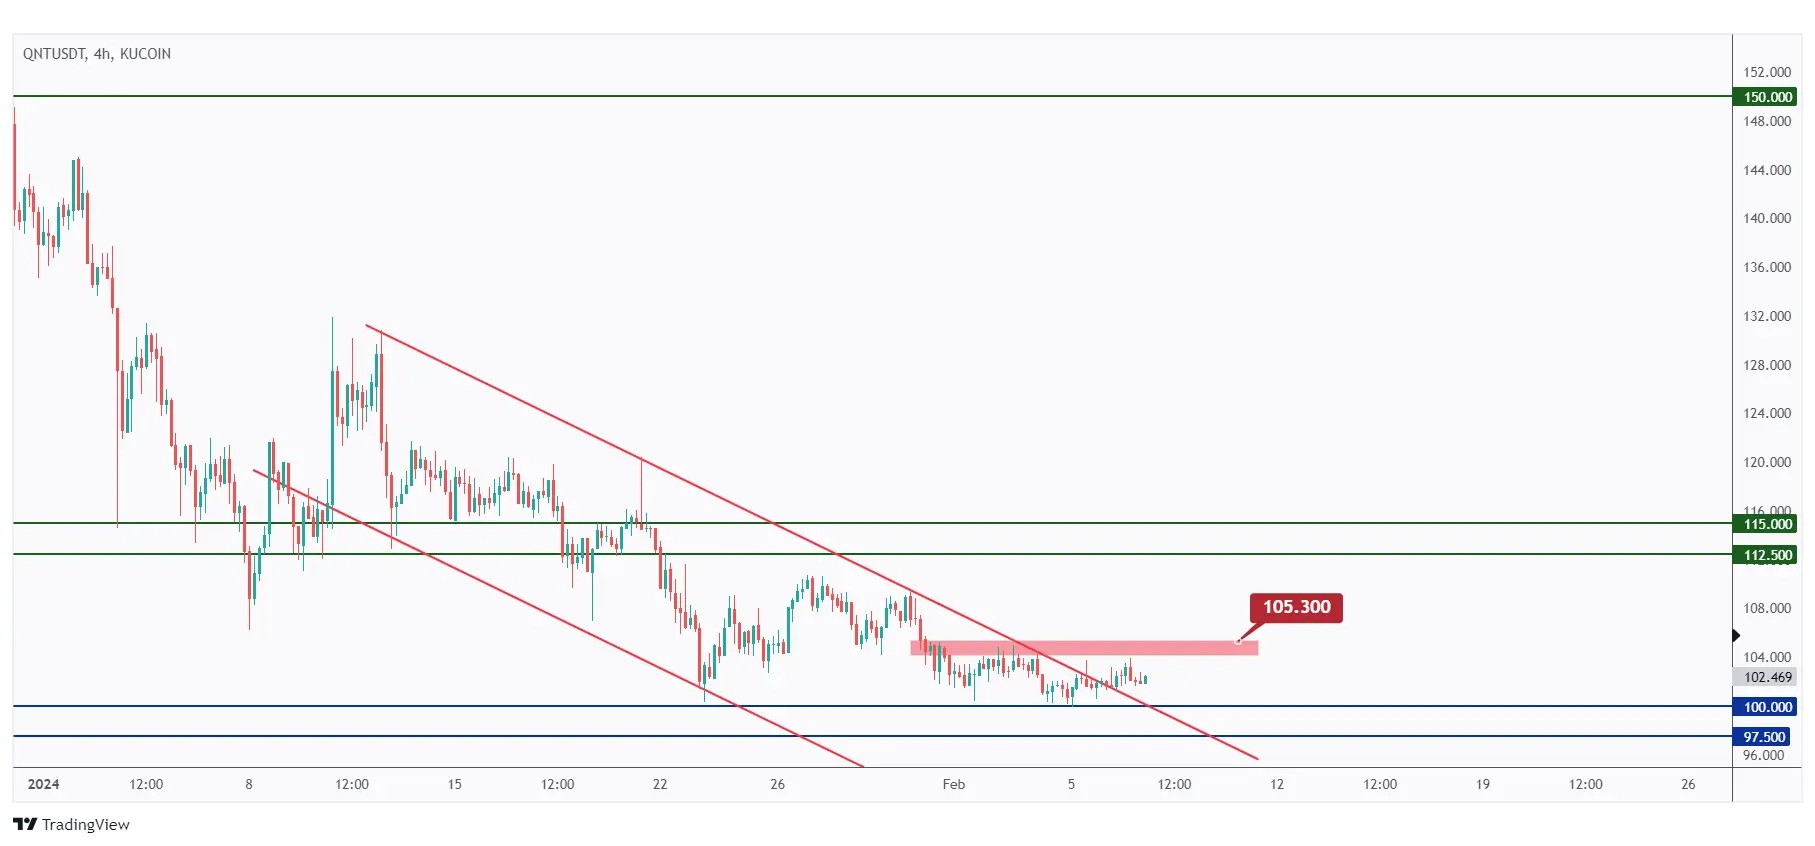
In the 4-hour timeframe, QNT has shown a bearish trend from a medium-term perspective, trading within the falling channel marked in red.
For the bulls to assume control and initiate the next upward impulse movement, a breakout above the last major high at $105.3 is necessary.
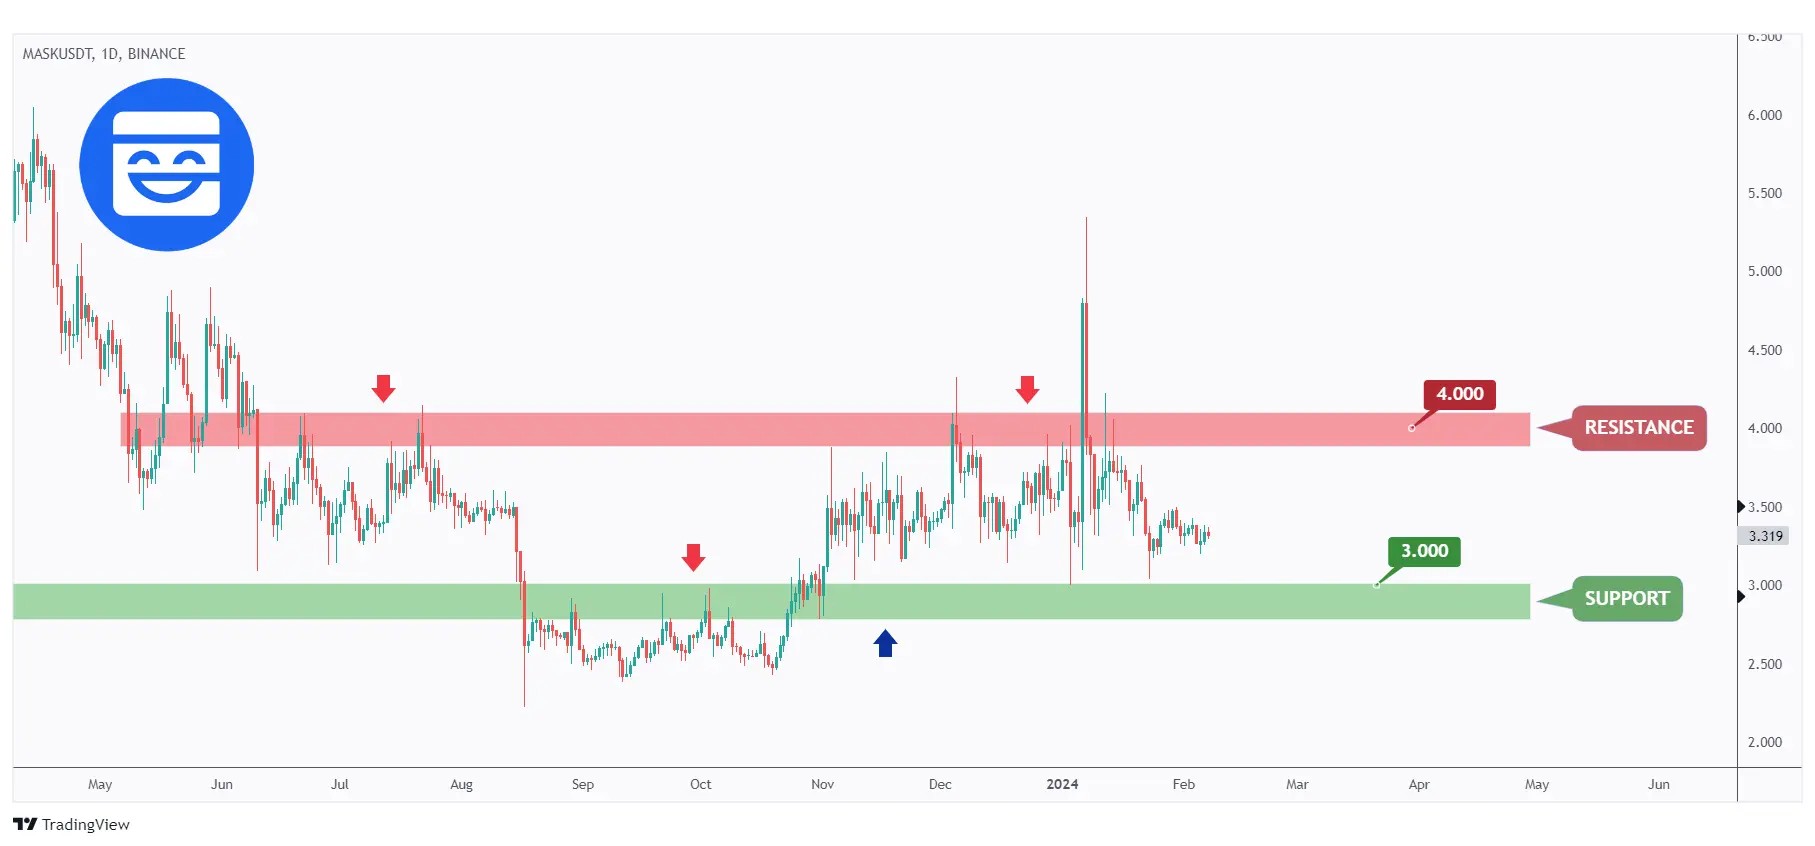
MASK has been consolidating within a range between $3 and $4.
At present, MASK is retesting the lower bound of the range and the support zone, hence we will be looking for potential buy setups on lower timeframes.
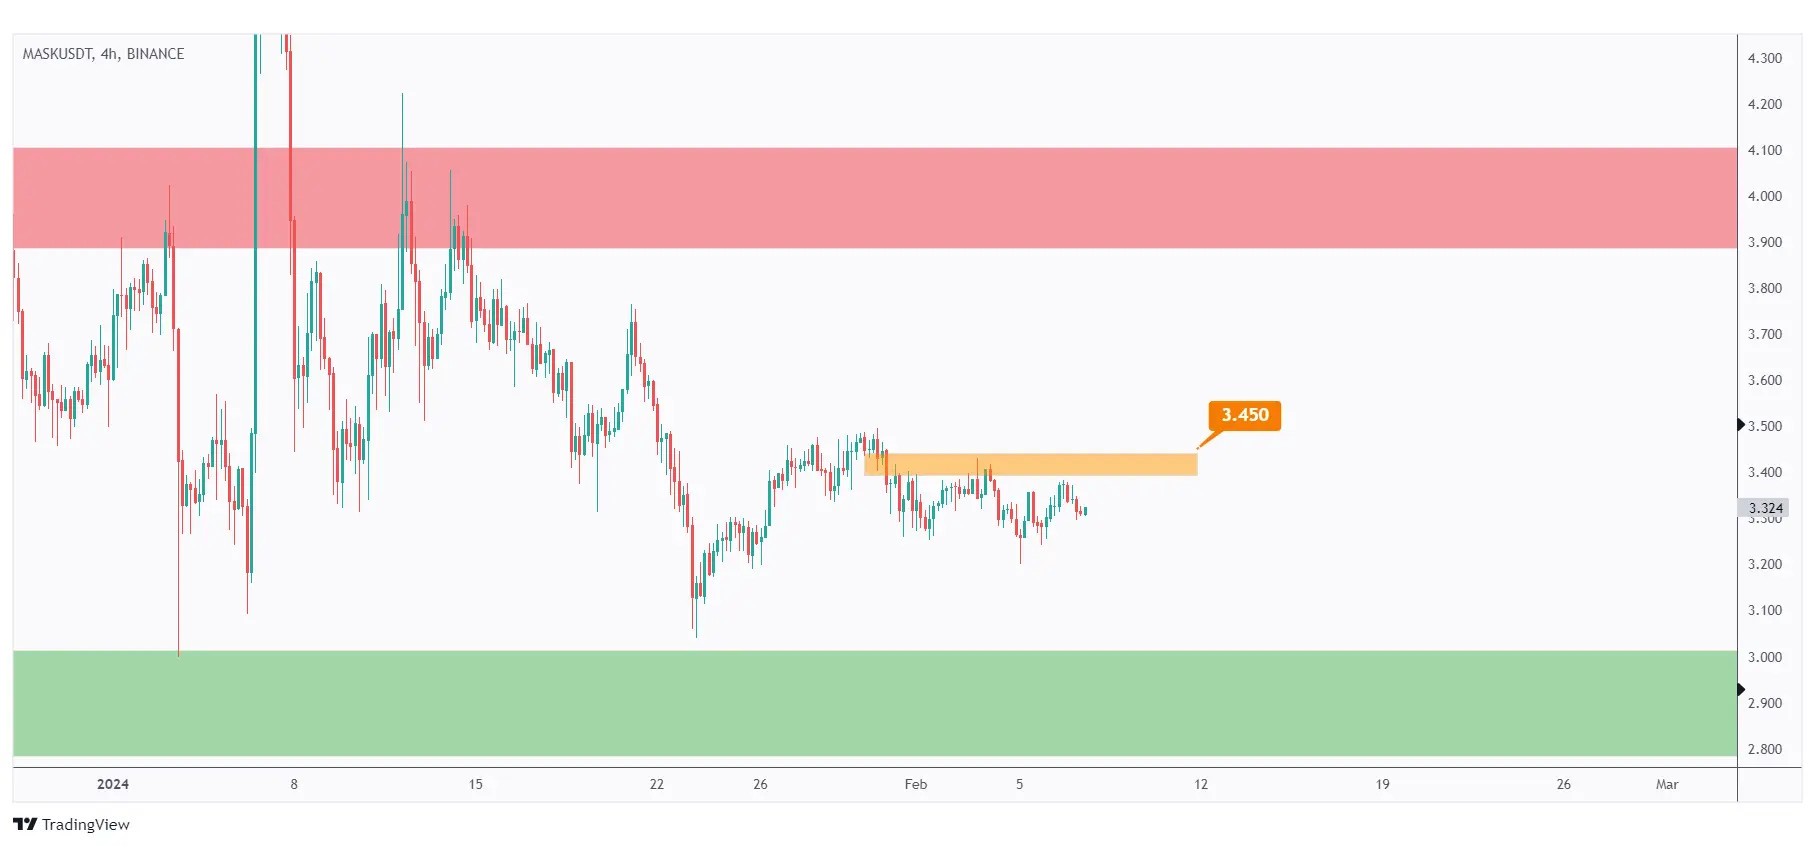
For the bulls to regain control, a momentum candle close above the last major high highlighted in orange at $3.45 is necessary.
Meanwhile, MASK is expected to remain bearish and may continue to decline, potentially retesting the $3 support zone.
Quotes / Advices
Here are my 4 favorite trading quotes for the week:
"The market can stay irrational longer than you can stay solvent." ~John Maynard Keynes
"If most traders would learn to sit on their hands 50 percent of the time, they would make a lot more money." ~Bill Lipschutz
"Don’t worry about what the markets are going to do, worry about what you are going to do in response to the markets." ~Michael Carr
"It’s not whether you’re right or wrong that’s important, it’s how much money you make when you’re right and how much you lose when you’re wrong." ~George Soros
Closing Remarks
In summary, USDT.D analysis indicates consolidation within a narrow range, with potential bullish movement if support holds.
BTC remains near $43,700, requiring a breakout to push towards $50,000 resistance.
SKL saw a successful breakout above $0.03 resistance level, now undergoing correction.
RUNE is trading within a descending channel, approaching a strong demand zone at $3.5.
IOTA is bearish within a descending channel, requiring a breakout above $0.27 for bullish momentum.
QNT is bounded by $100 support and $115 resistance, approaching lower bound for potential buy setups.
MASK consolidates within $3-$4 range, retesting lower bound with potential for bullish reversal above $3.45.