
elcome to another crypto market outlook for the 5th of February!
In this edition, we'll delve into major assets such as US500, DXY, Gold, Bitcoin, and Ethereum, highlighting critical levels and potential trade setups.
From Bitcoin experiencing a ranging week around support to ETH remaining overall bearish, and the Fear & Greed Index signaling "Neutral" after a couple of months of "Greed" sentiment, this article covers it all.
Are you ready?
Today, we will cover the following topics:
- Market Heatmap and Fear and Greed Index
- US500, DXY and Gold Analysis
- USDT.D, Bitcoin and Ethereum Analysis
- Quotes / Advices
- Closing Remarks
Market Heatmap and Fear and Greed Index
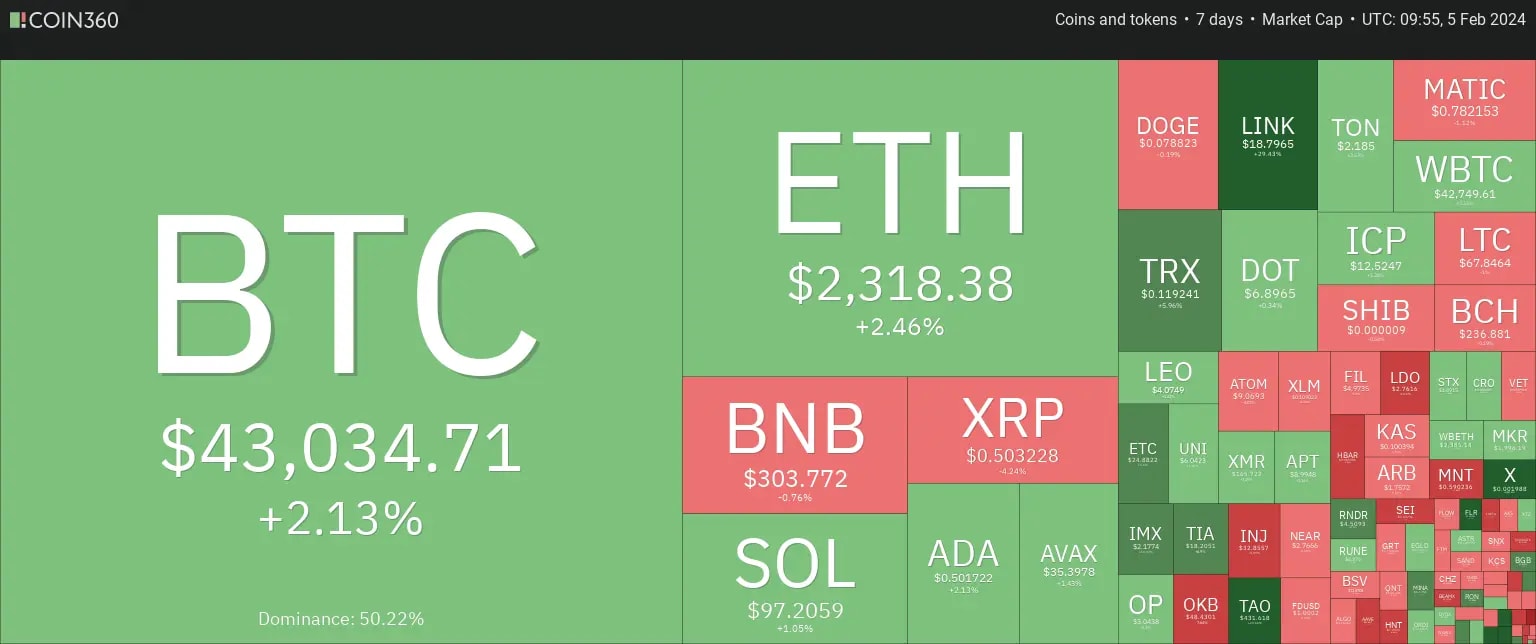
To initiate my research, I delved into the analysis by examining the market heatmap, which provided a comprehensive overview of the entire cryptocurrency market.
After being rejected at the $43,700 resistance zone, BTC has been consolidating within a range for an entire week, experiencing a 2.13% increase. This has positively influenced several altcoins.
On the heatmap, a mix of red and green colors is noticeable. Despite the bullish movement towards the week's end, certain altcoins have maintained an overall bearish trend over the past 7 days.
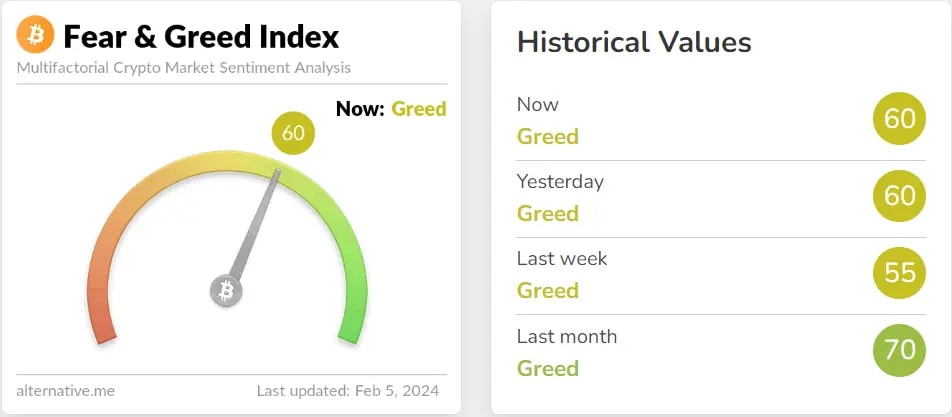
The Fear & Greed Index has consistently signaled "Greed" throughout the entire week, suggesting that traders remain optimistic following the approval of Bitcoin ETFs and with the halving on the horizon.
US500, DXY and Gold analysis
We consistently monitor the US500 index to assess the current market sentiment. This practice is crucial because the cryptocurrency market often exhibits a significant correlation with the stock market, and this interconnection can impact its fluctuations.
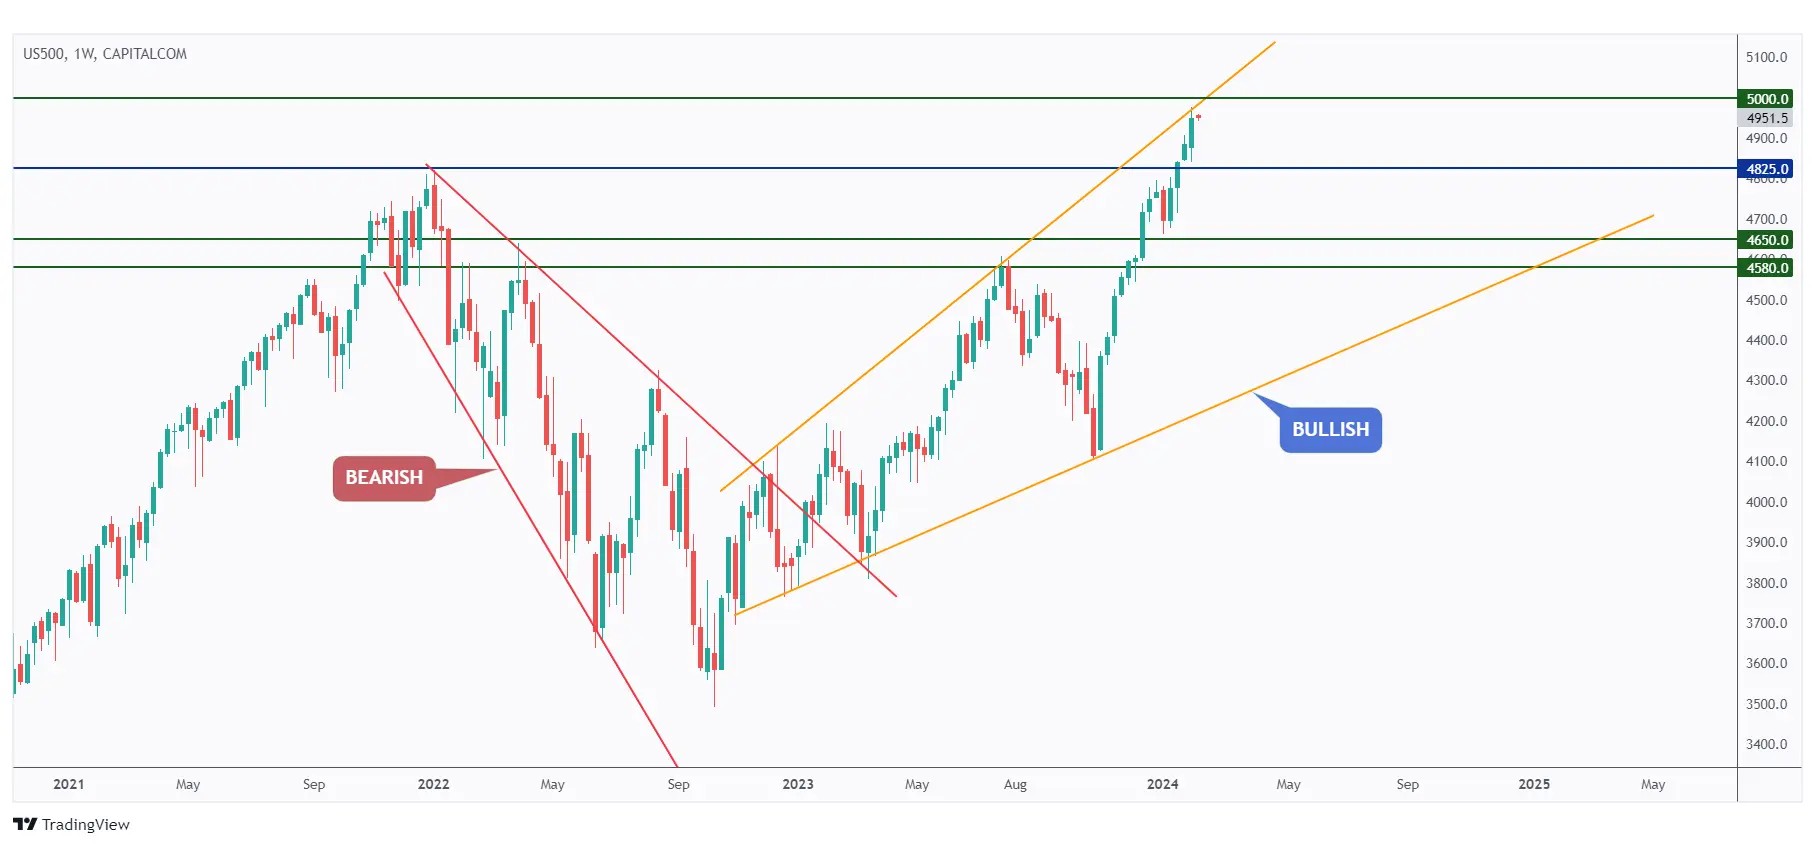
Following a successful breach of the previous all-time high, US500 continues to display a bullish trend, establishing new all-time highs.
However, it is currently approaching the upper boundary of the orange wedge channel and the round number of $5000, which might act as a potential non-horizontal resistance zone.
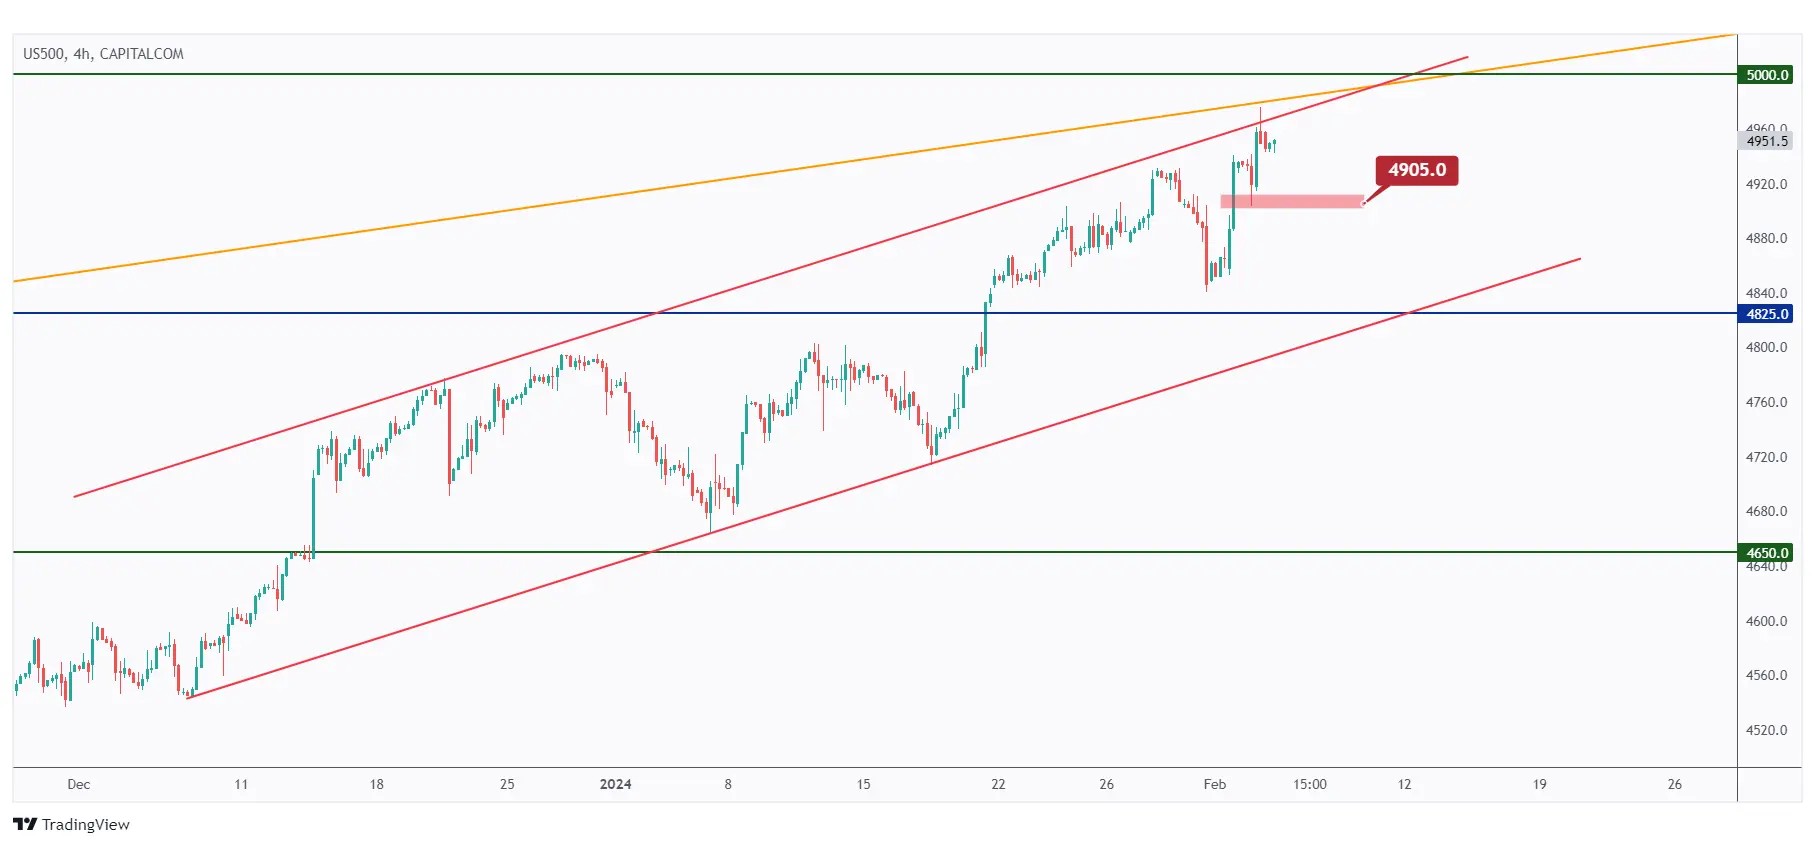
In the 4-hour timeframe, the bulls will maintain control as long as the last major low remains unbroken.
However, if the $4905 low is breached downward, a correction is anticipated, potentially leading to a movement towards the lower bound of the red channel at $4825.
We consistently monitor the DXY - USD Index as part of our routine analysis. This is crucial because the value of nearly all assets, including BTC/USD, is closely tied to the USD, which serves as the benchmark currency in the financial market.
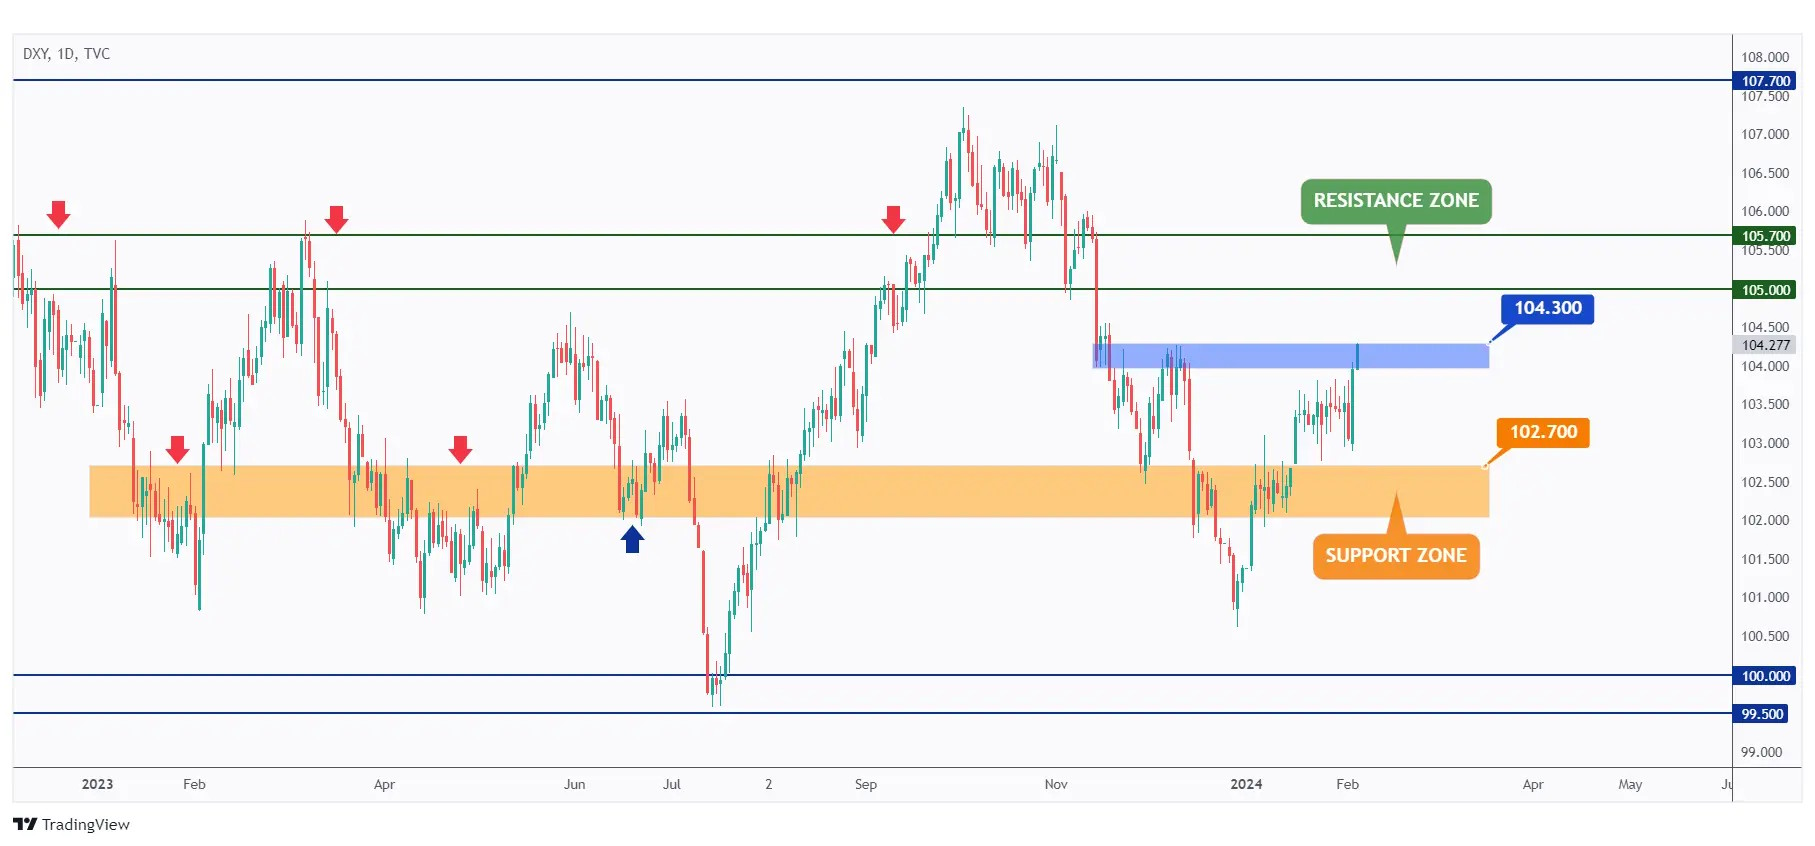
After rejecting the $102.7 support, DXY traded higher and is currently approaching a major high at $104.3.
Should the $104.3 level, marked in blue, be breached upward, we expect further continuation towards the next resistance at $105.
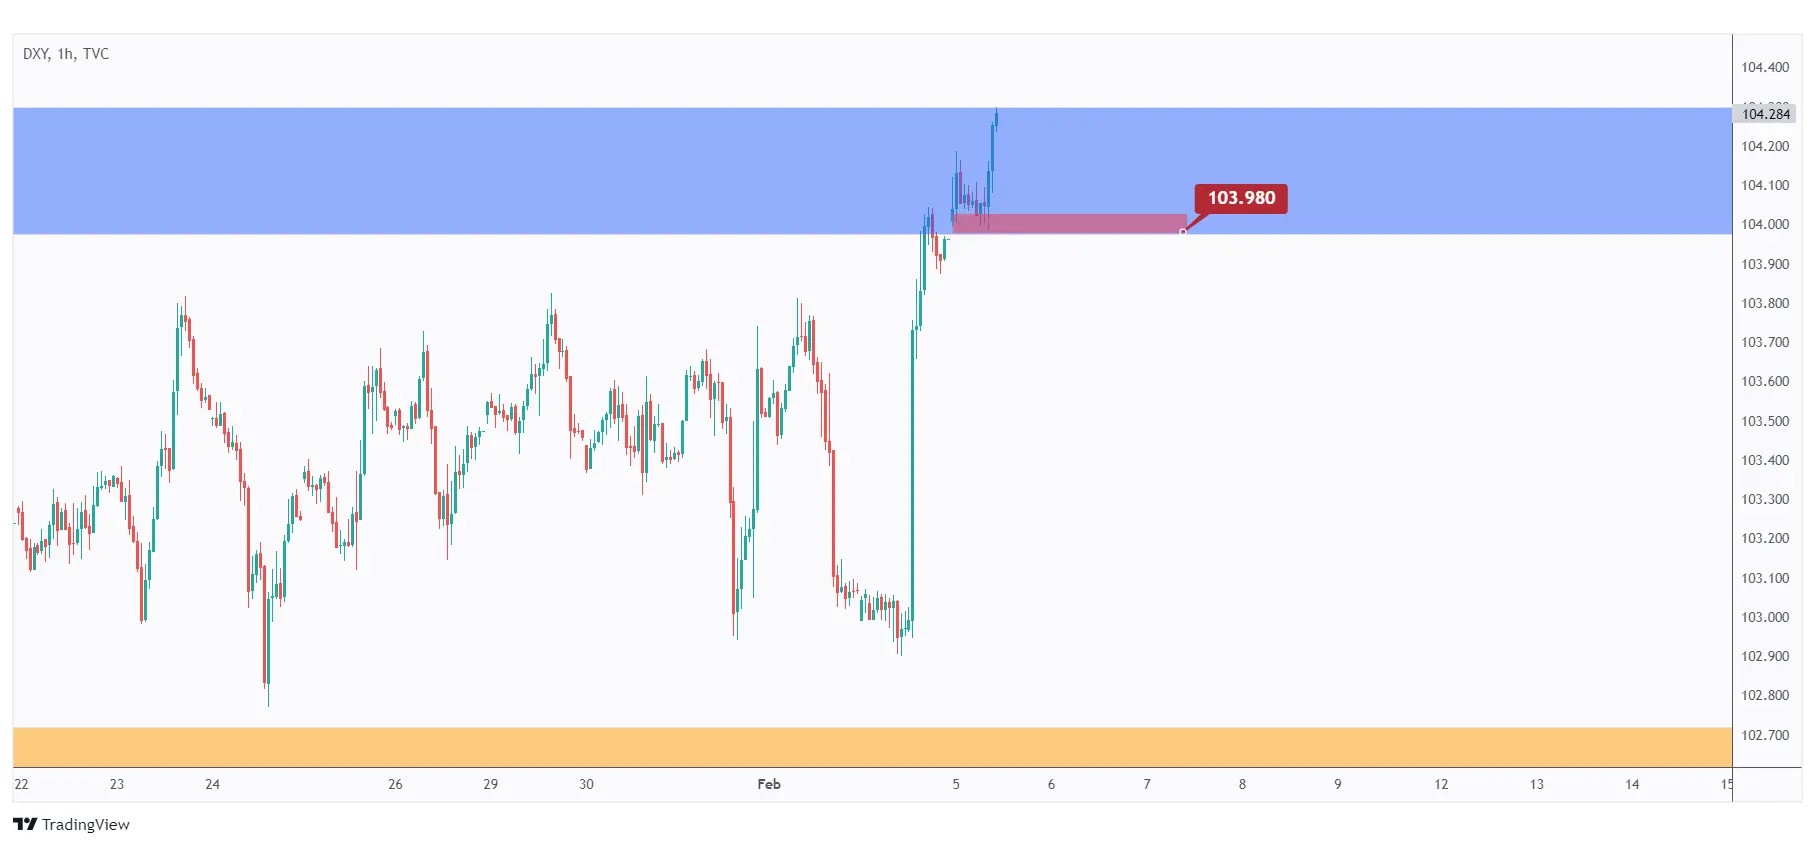
In parallel, for the bears to gain control and shift the momentum from bullish to bearish, a break below the last low, indicated in red at $103.98, is needed.
In such a scenario, a bearish movement is anticipated, potentially leading towards the $103 demand zone.
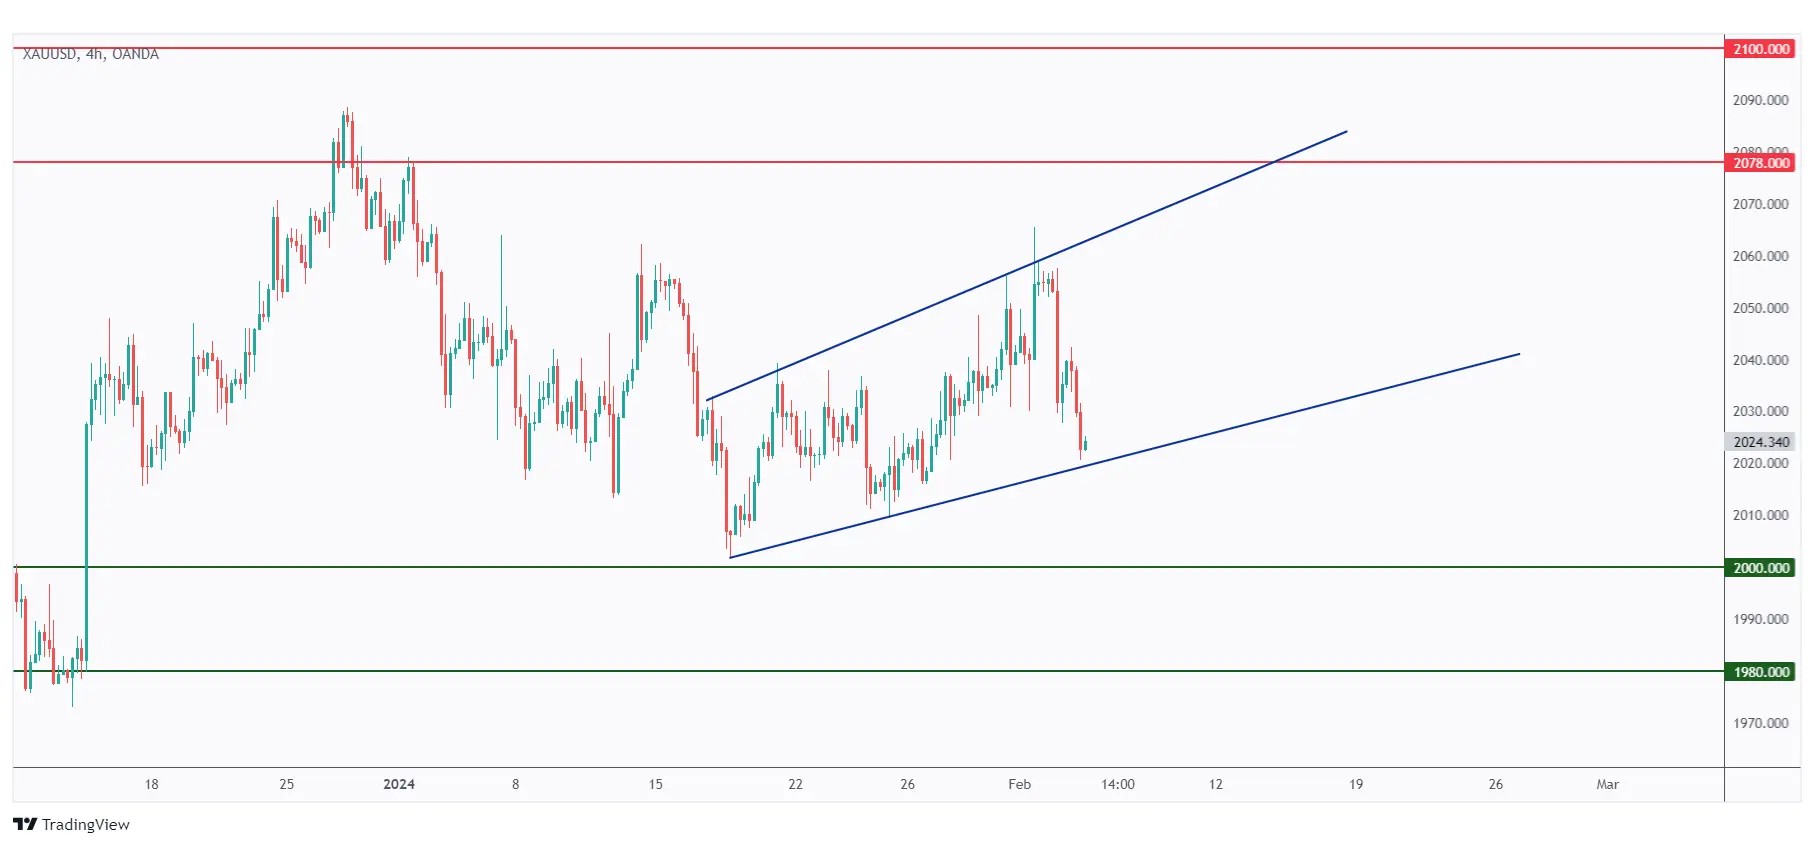
Gold has been trading overall bullish from a medium-term perspective, trading within the ascending channel marked in blue.
Currently, Gold is approaching the lower bound of the channel, so we will actively look for buy setups on lower timeframes.
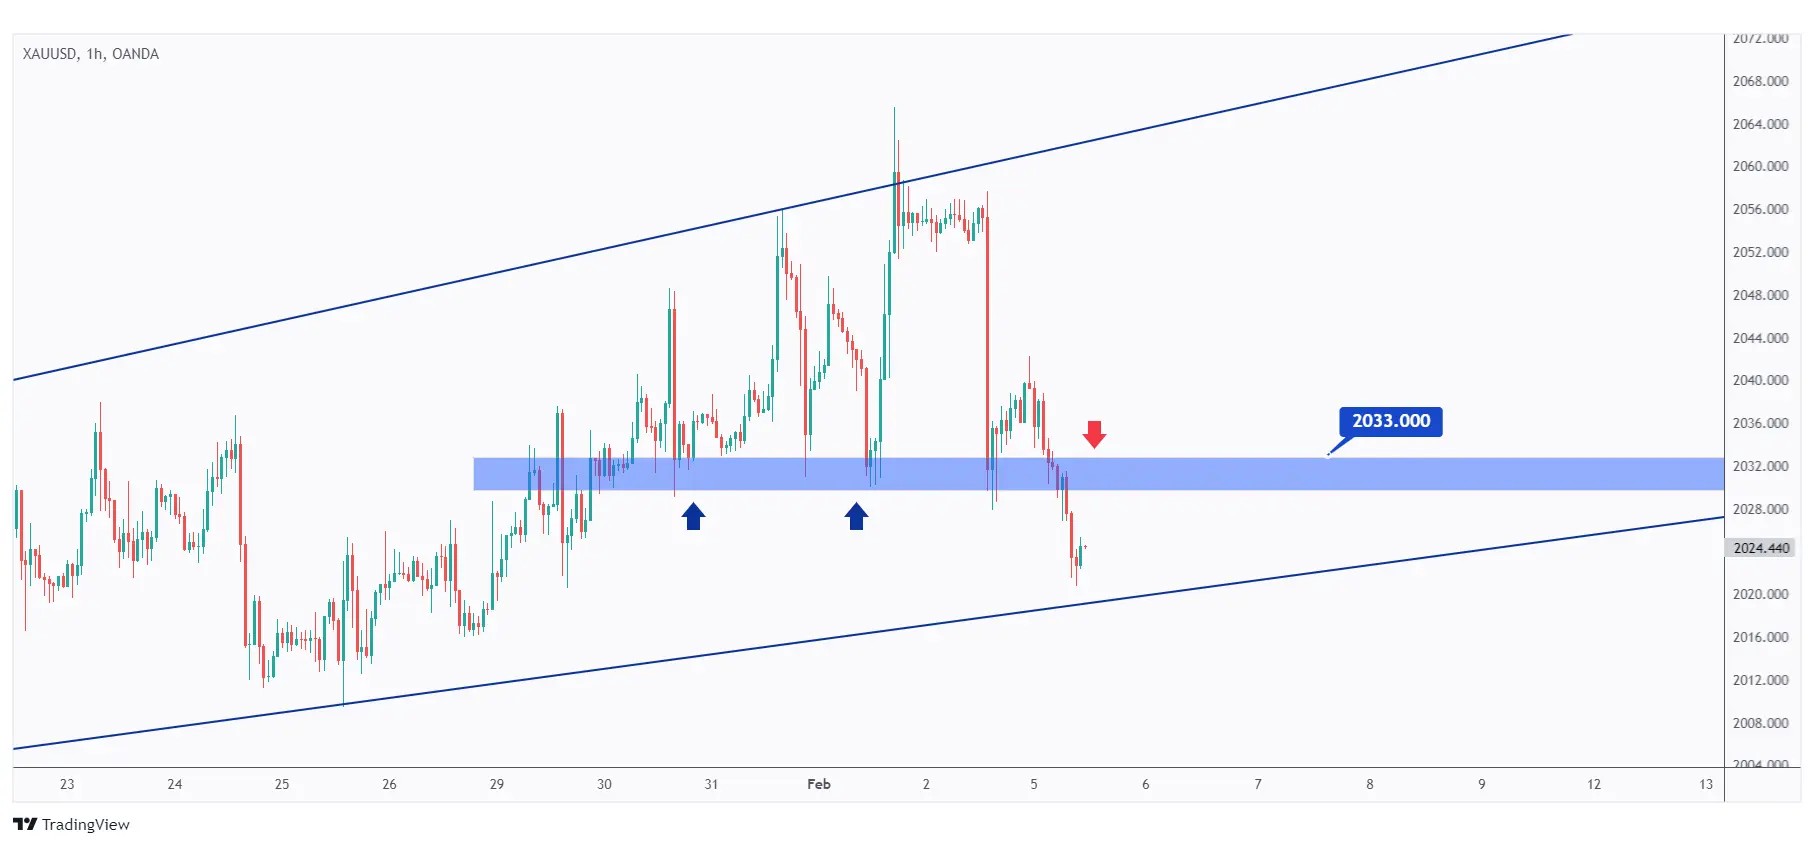
In the 1-hour timeframe, for the bulls to take control and initiate the next upward impulse movement, a breakout above the structure highlighted in blue at $2033 is required.
Meanwhile, Gold may still decline to test the daily support at $2000. In such a scenario, we will actively look for new short-term buy setups.
USDT.D, Bitcoin and Ethereum analysis
As a standard practice, I commence my analysis with USDT.D as it serves as a crucial indicator of traders' sentiment. USDT.D offers valuable insights into whether traders are optimistic, signaling increased investment in cryptocurrencies, or pessimistic, indicating a shift towards stablecoins.
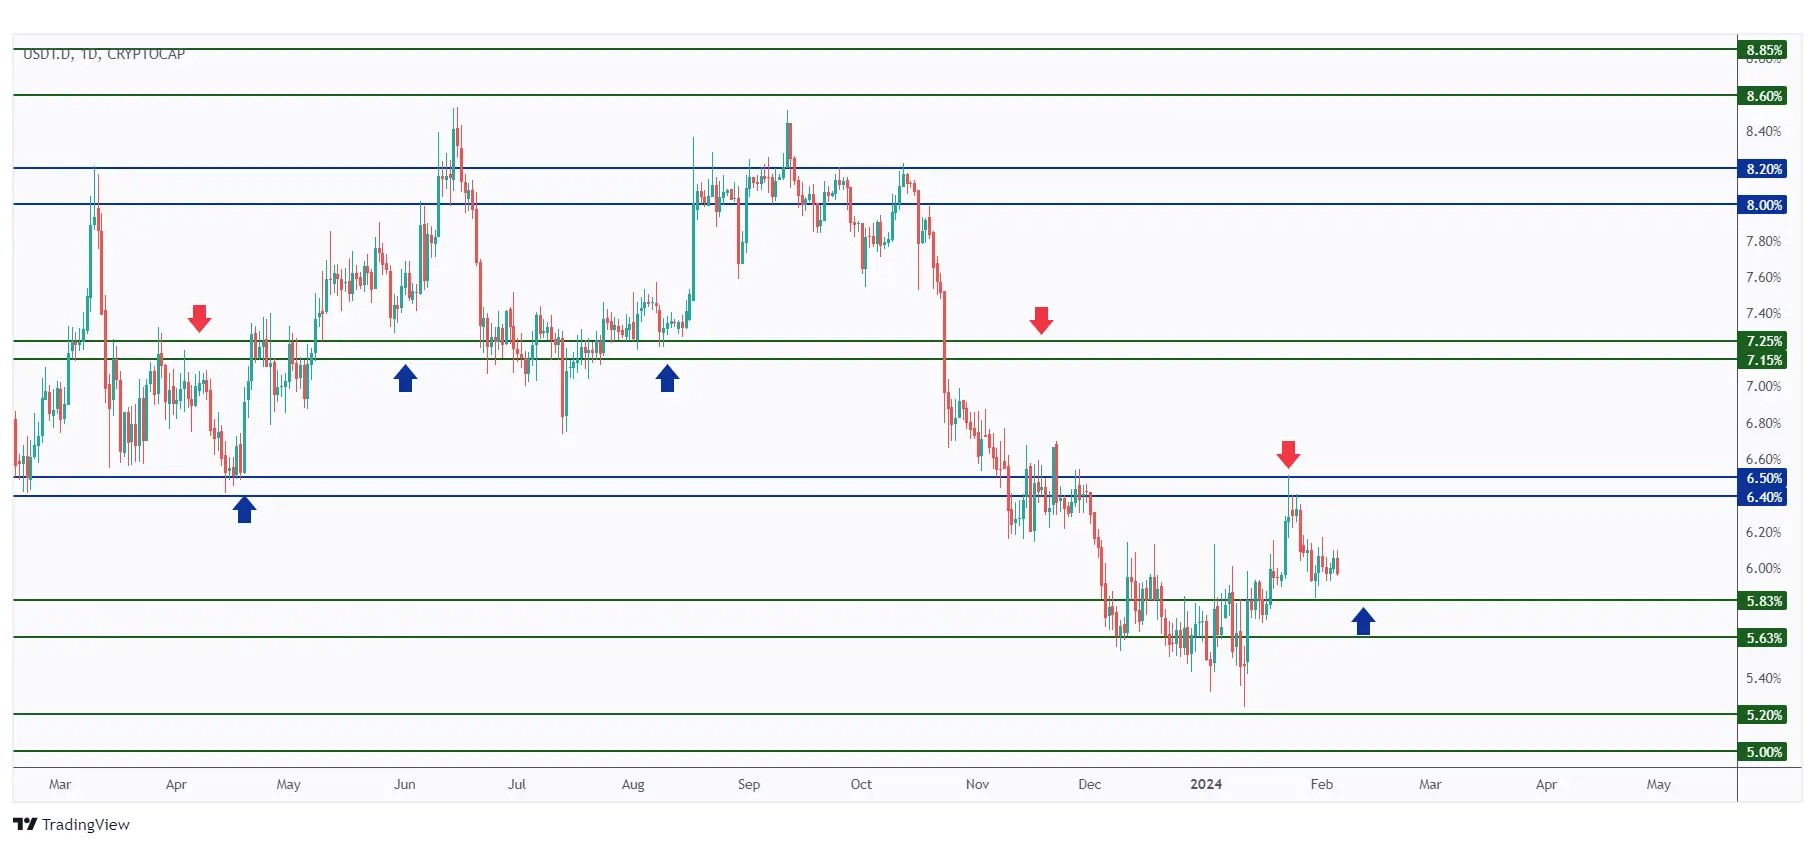
After rejecting the 6.5% resistance, USDT.D traded lower and is currently approaching a strong support zone at 5.83%.
As long as the 5.63% support holds, we anticipate the bulls to kick, which would have a negative impact on the overall sentiment in the crypto market.
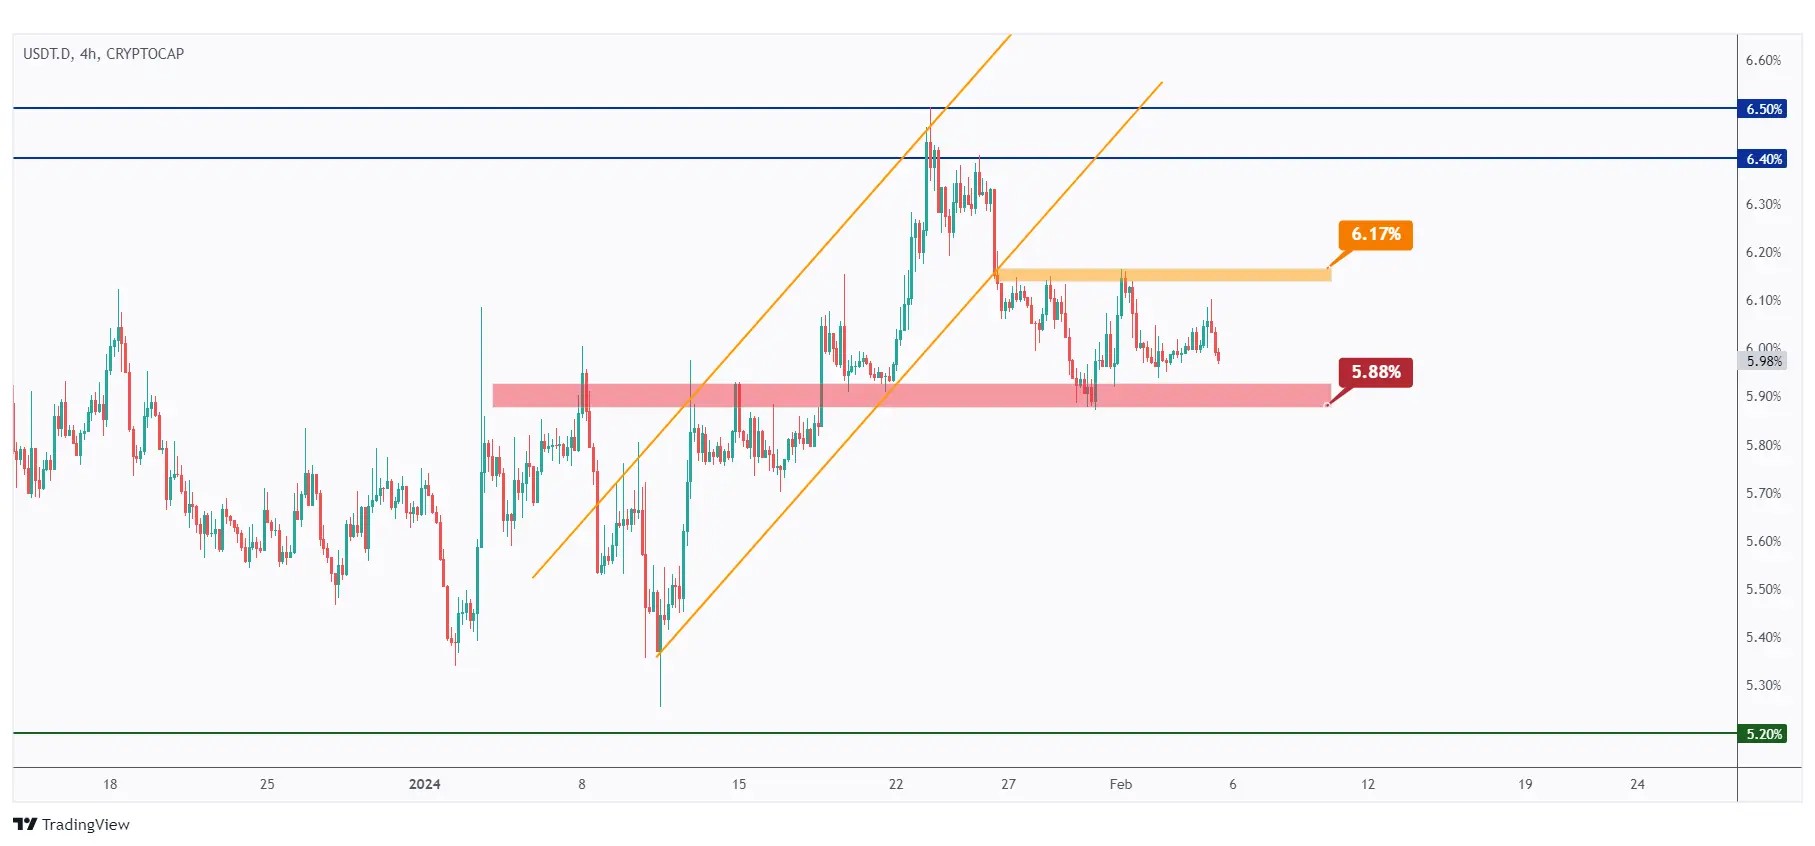
In the 4-hour timeframe, USDT.D has remained within a tight range, trading between 5.88% and 6.17%.
If the 5.88% support level is breached downward, we anticipate a continuation of bearish momentum towards the 5.5% demand zone.
In parallel, if the 6.17% resistance level is broken upward, we anticipate a movement towards the next resistance at 6.4%.
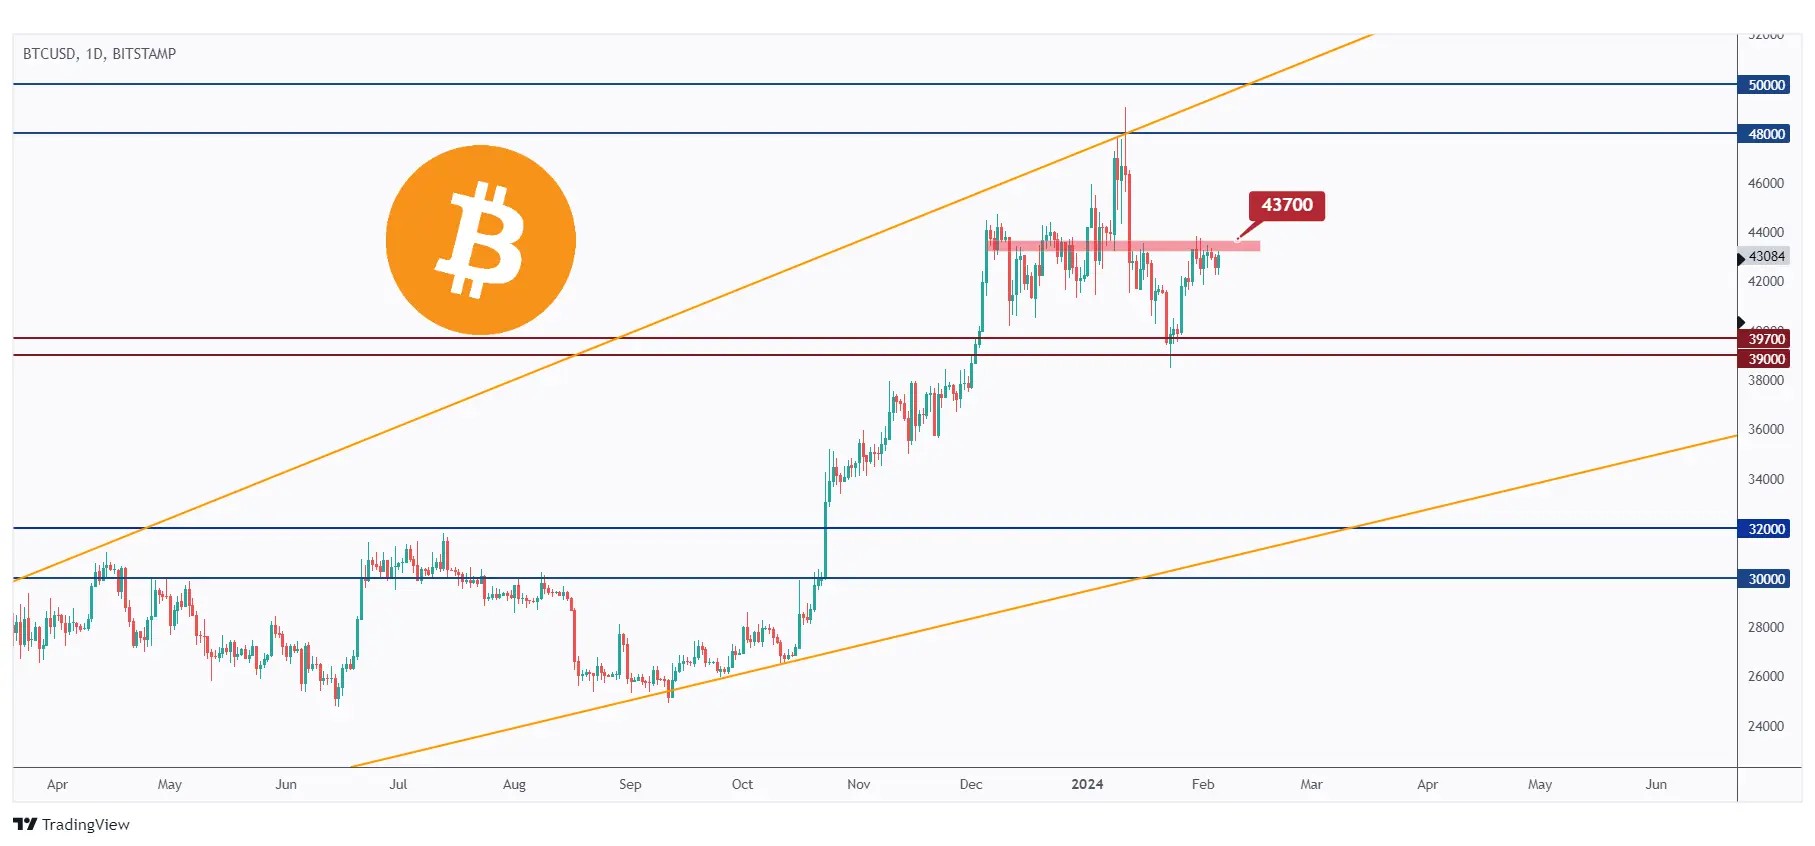
This week, BTC has been rather uneventful, trapped in a tight range around the $43,700 resistance.
To keep the bulls in control and pave the way for a potential retest of the $50,000 resistance zone, a breakthrough above the crucial previous high at $43,700 is essential.
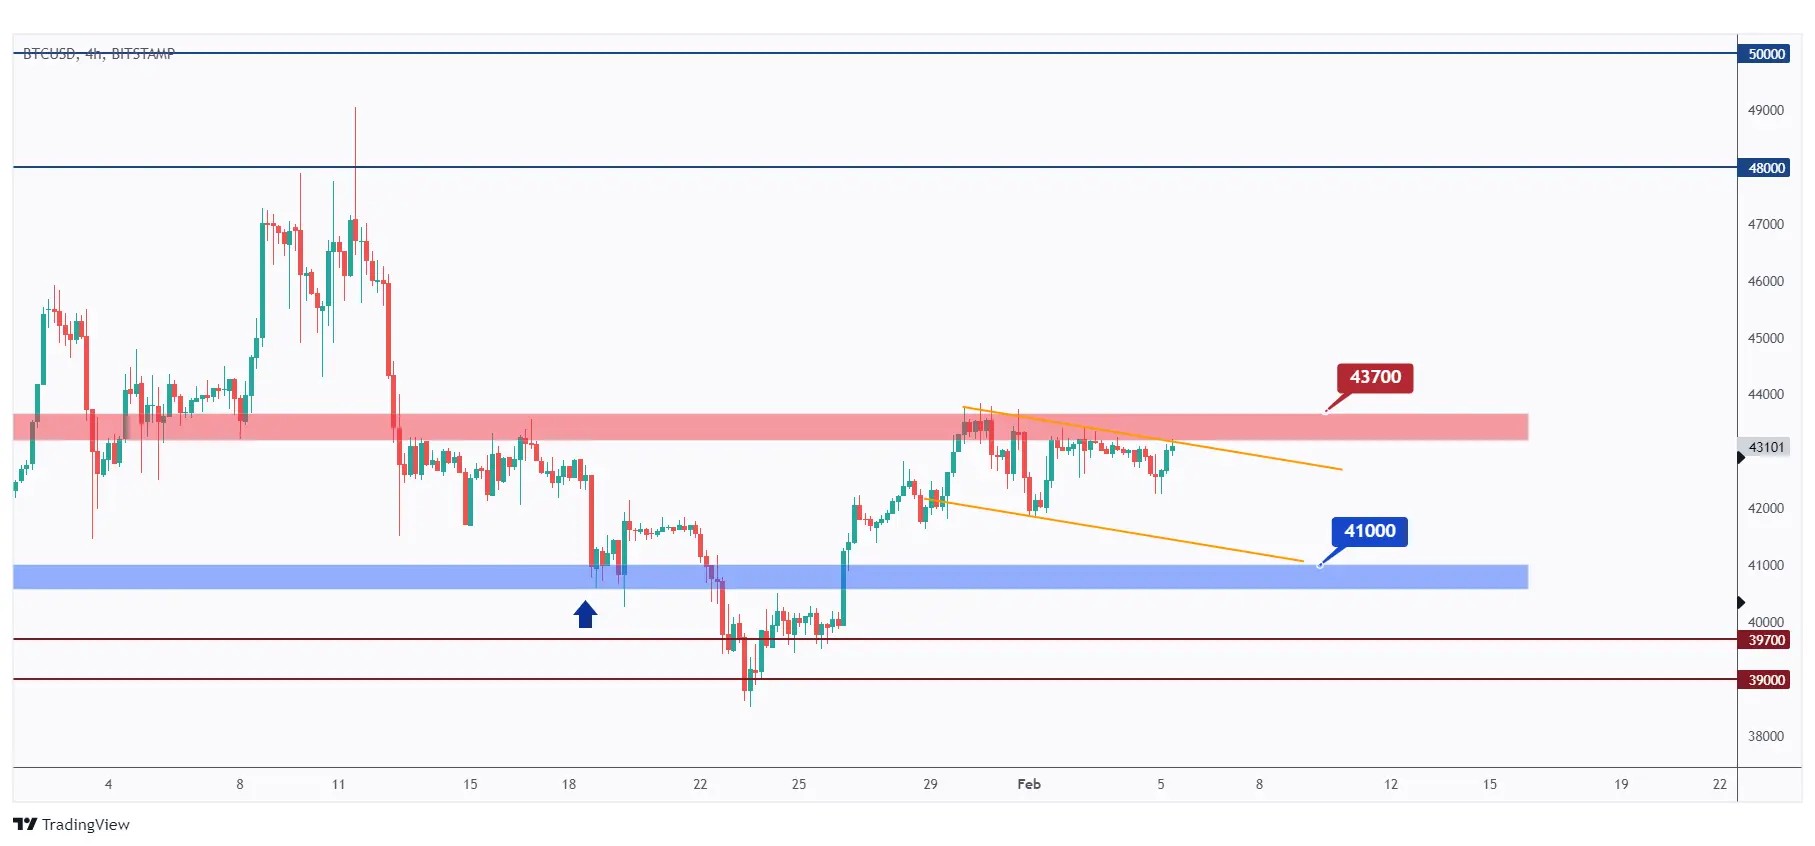
In the 4-hour timeframe, BTC has been bearish trading within a flat falling channel marked in orange.
To shift the momentum in favor of the bulls, a breakout above $43,700 is required. However, BTC may still experience a decline towards the lower boundary of the orange channel and the $41,000 support.
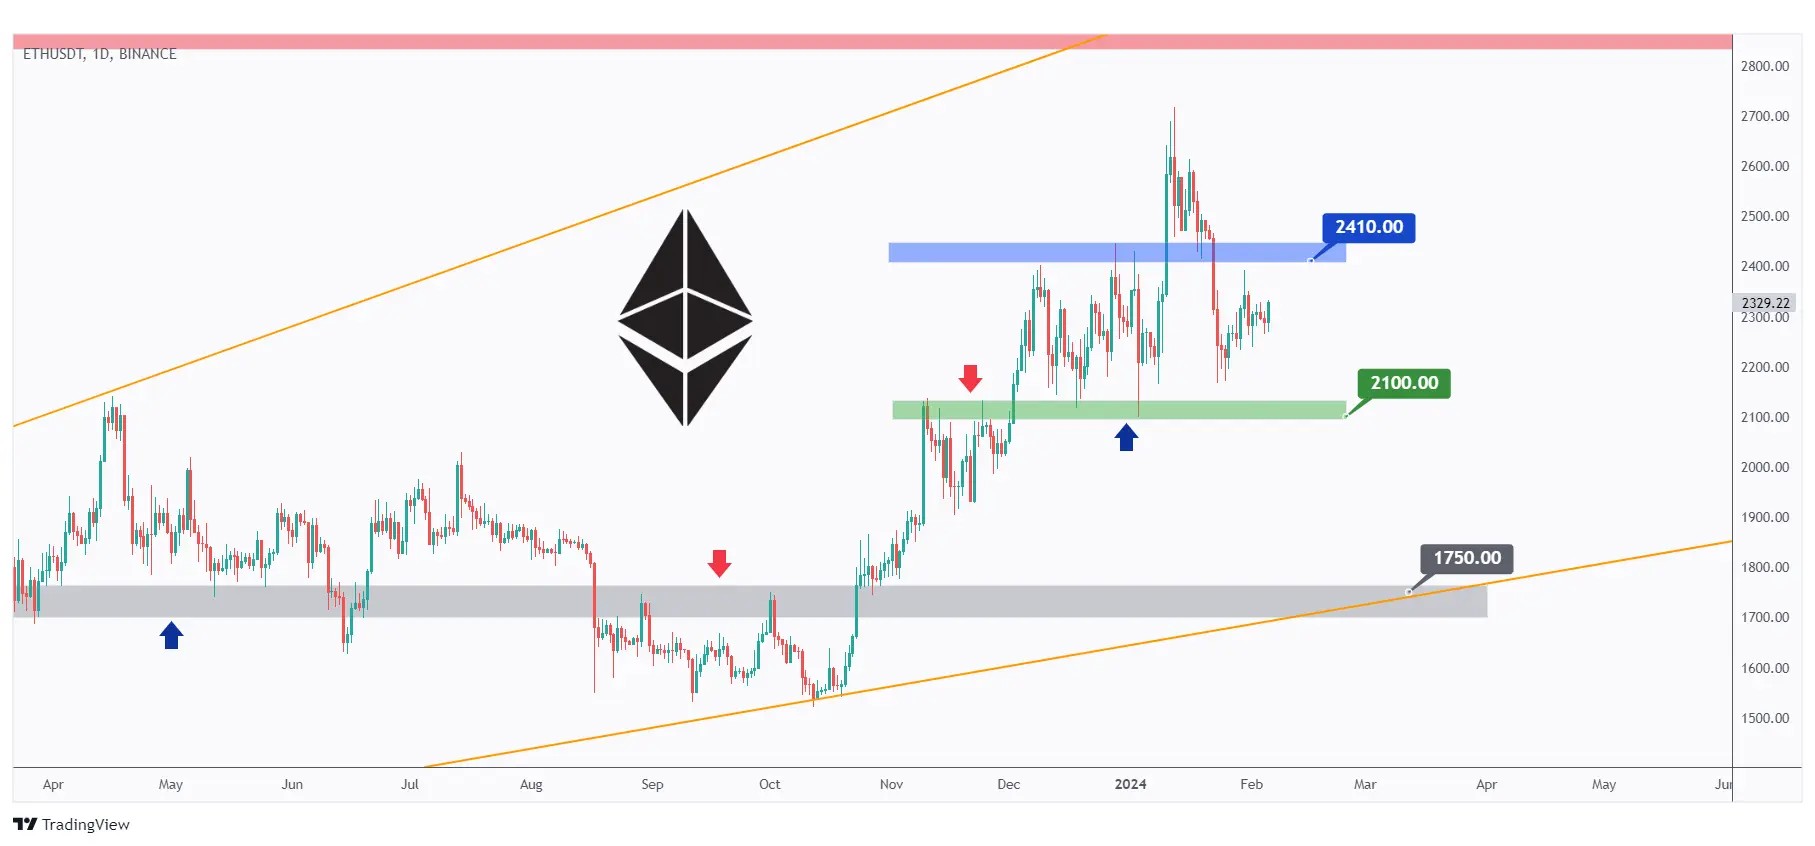
ETH is currently trading between our $2100 support and $2410 resistance.
As ETH approaches the $2100 support, we will actively search for buy setups on lower timeframes.
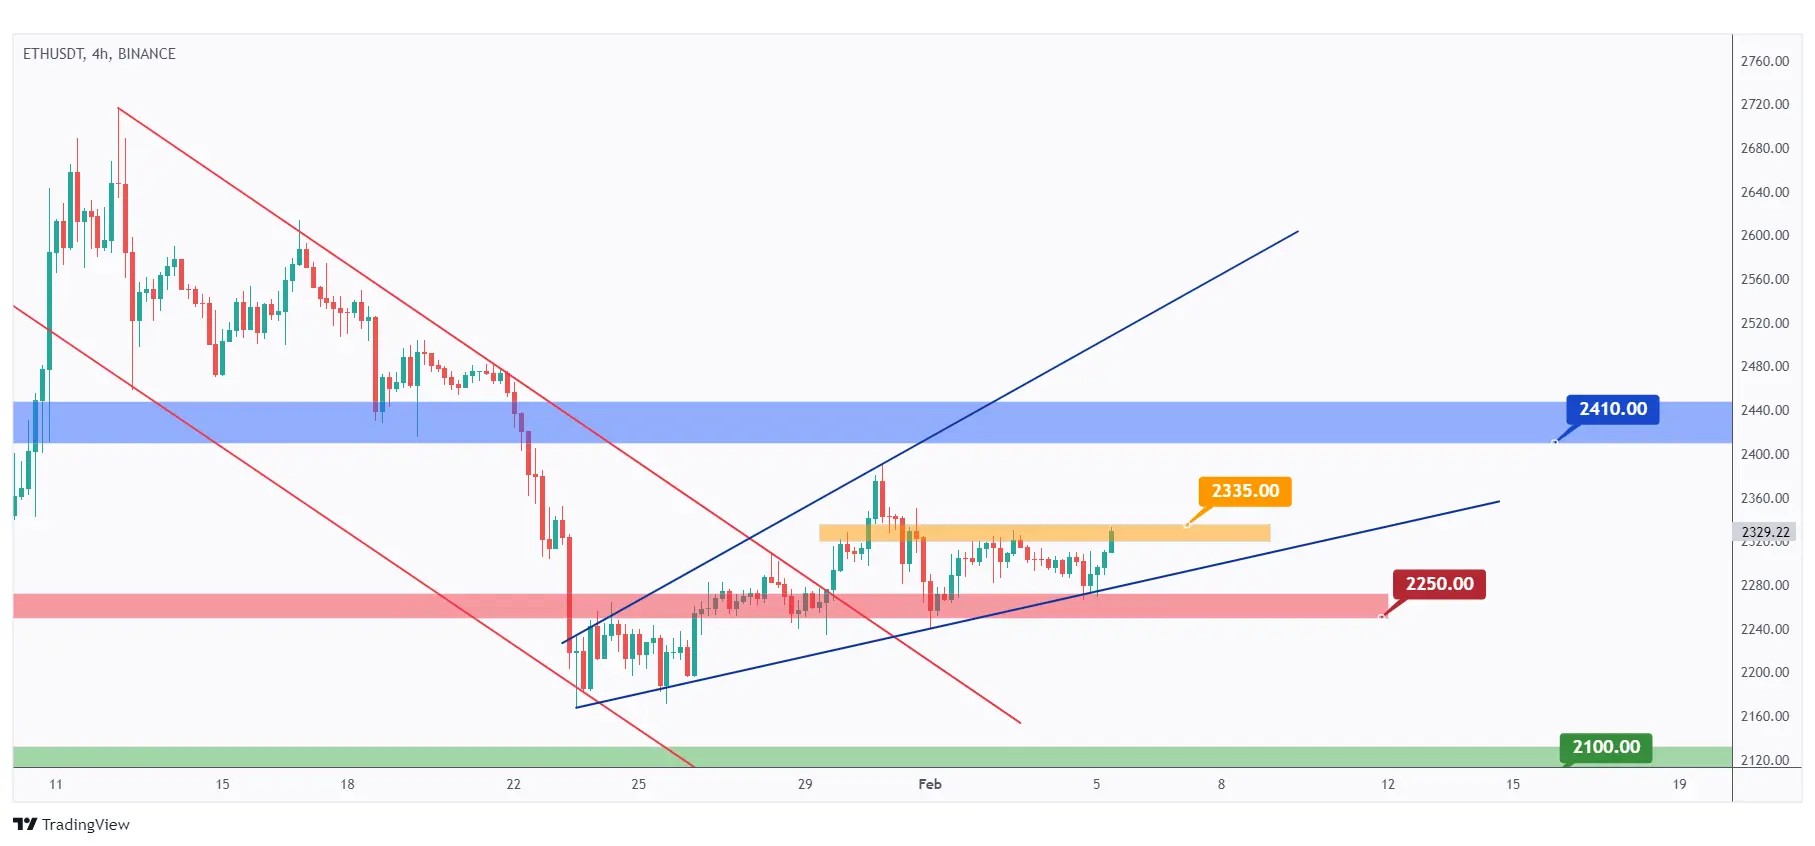
In the 4-hour timeframe, ETH has maintained an overall bullish trend, trading within the rising wedge pattern marked in blue.
Currently, ETH is retesting the lower bound of the wedge pattern, so we will be looking for trend-following setups.
For the bulls to regain control, a breakout above the last major high in orange at $2335 is needed.
In parallel, if the $2250 support is breached downward, we anticipate a movement towards the $2100 level.
Quotes / Advices
Trading, like driving, thrives on strategy and adaptability in navigating market uncertainties.
Stay in Your Lane: Stick to your trading strategy, just like staying in your lane while driving prevents accidents.
Check Your Blind Spots: Regularly review market trends and potential risks, similar to checking blind spots while driving.
Use Signals Wisely: Follow market indicators like traffic signals—wait for the green before proceeding.
Plan Your Route: Have a clear trading plan and set goals, akin to planning your route before driving to a destination.
Closing Remarks
In summary, this outlook encompasses a review of the cryptocurrency market's heatmap and Fear & Greed Index.
The Fear & Greed Index signals "Greed," reflecting optimism amid Bitcoin ETF approval and impending halving.
Analysis extends to traditional markets, with the US500 index displaying a bullish trend but approaching potential resistance.
DXY indicates a possible upward move, impacting BTC/USD.
Gold remains bullish but may test support at $2000.
USDT.D's rejection at 6.5% resistance signals potential bearish momentum.
BTC is in a tight range, requiring a breakout for bullish momentum, while ETH trades within defined support and resistance levels, with attention on the $2100 support.