elcome to another crypto market outlook for the 31st of January!
In today's market analysis, we will delve into the current state of the cryptocurrency market. BTC has rejected the $39,000 support, and USDT.D is hovering around a support zone.
Furthermore, we will cover five altcoins (LINK, SUI, OP, ROSE, and AAVE), emphasizing their key levels and potential trading setups.
Are you ready?
Today, we will cover the following topics:
- USDT.D and BTC Analysis
- 5 Altcoins Analysis
- Quotes / Advices
- Closing Remarks
USDT.D and BTC analysis
As usual, I always start my analysis with USDT.D as it serves as an indicator of traders' sentiment. USDT.D reflects whether traders are optimistic (investing in cryptocurrencies) or pessimistic (shifting towards stablecoins).
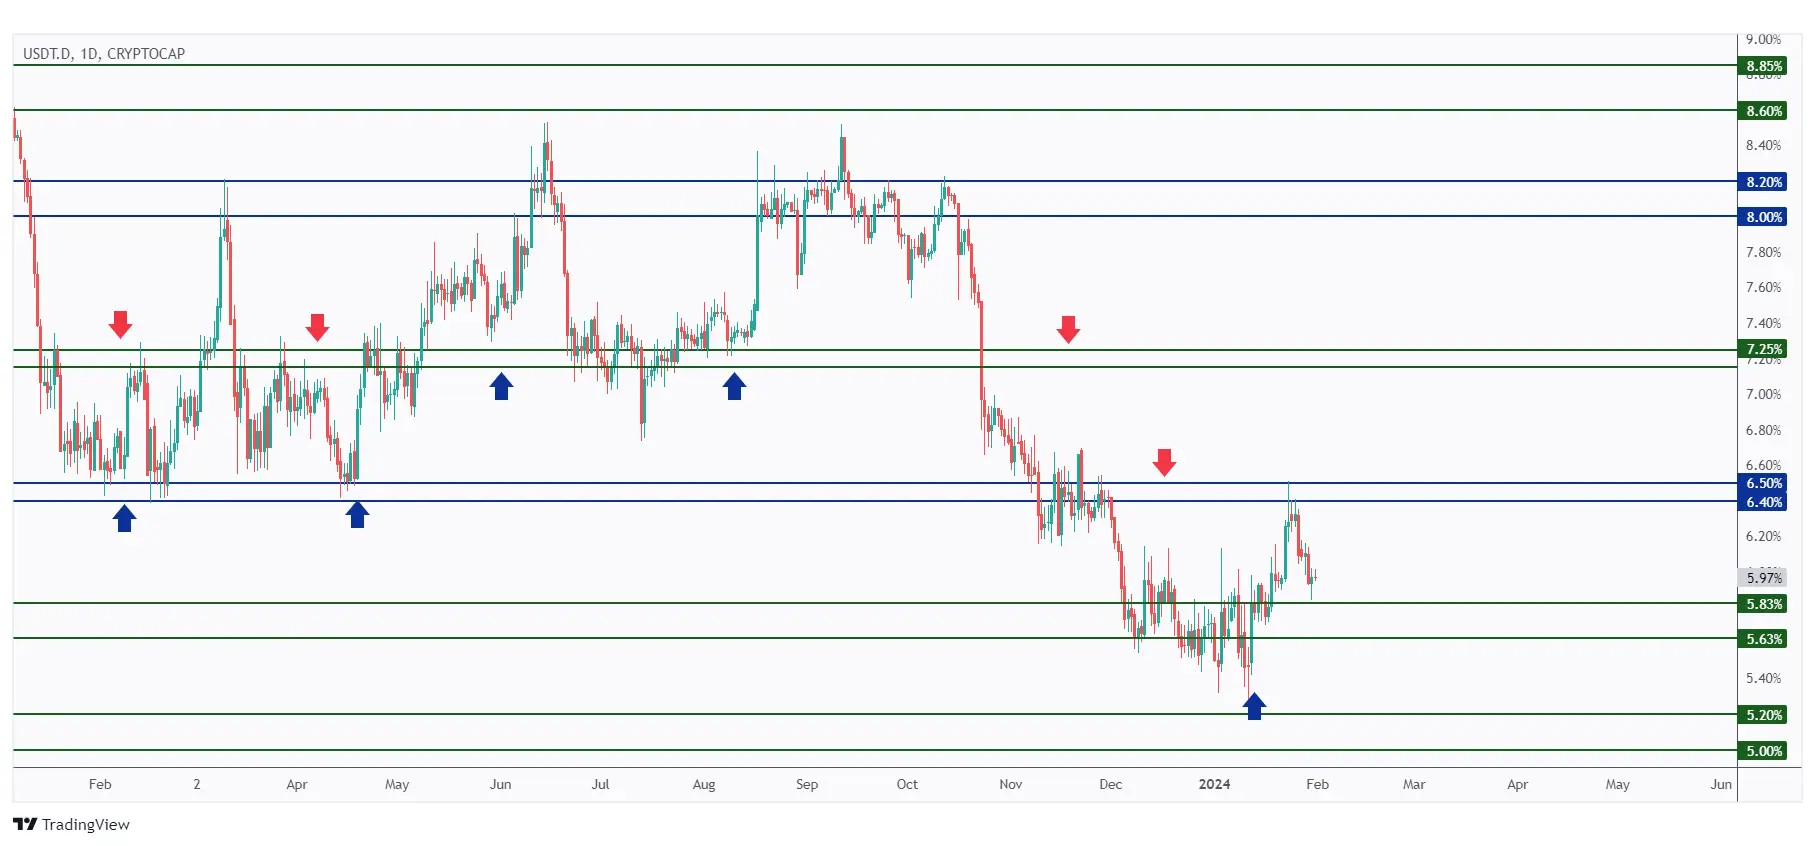
After rejecting the 6.5% resistance, USDT.D traded lower and is currently approaching a support at 5.63%.
As long as the support holds, we anticipate a bullish movement, which could negatively impact the overall sentiment in the crypto market.
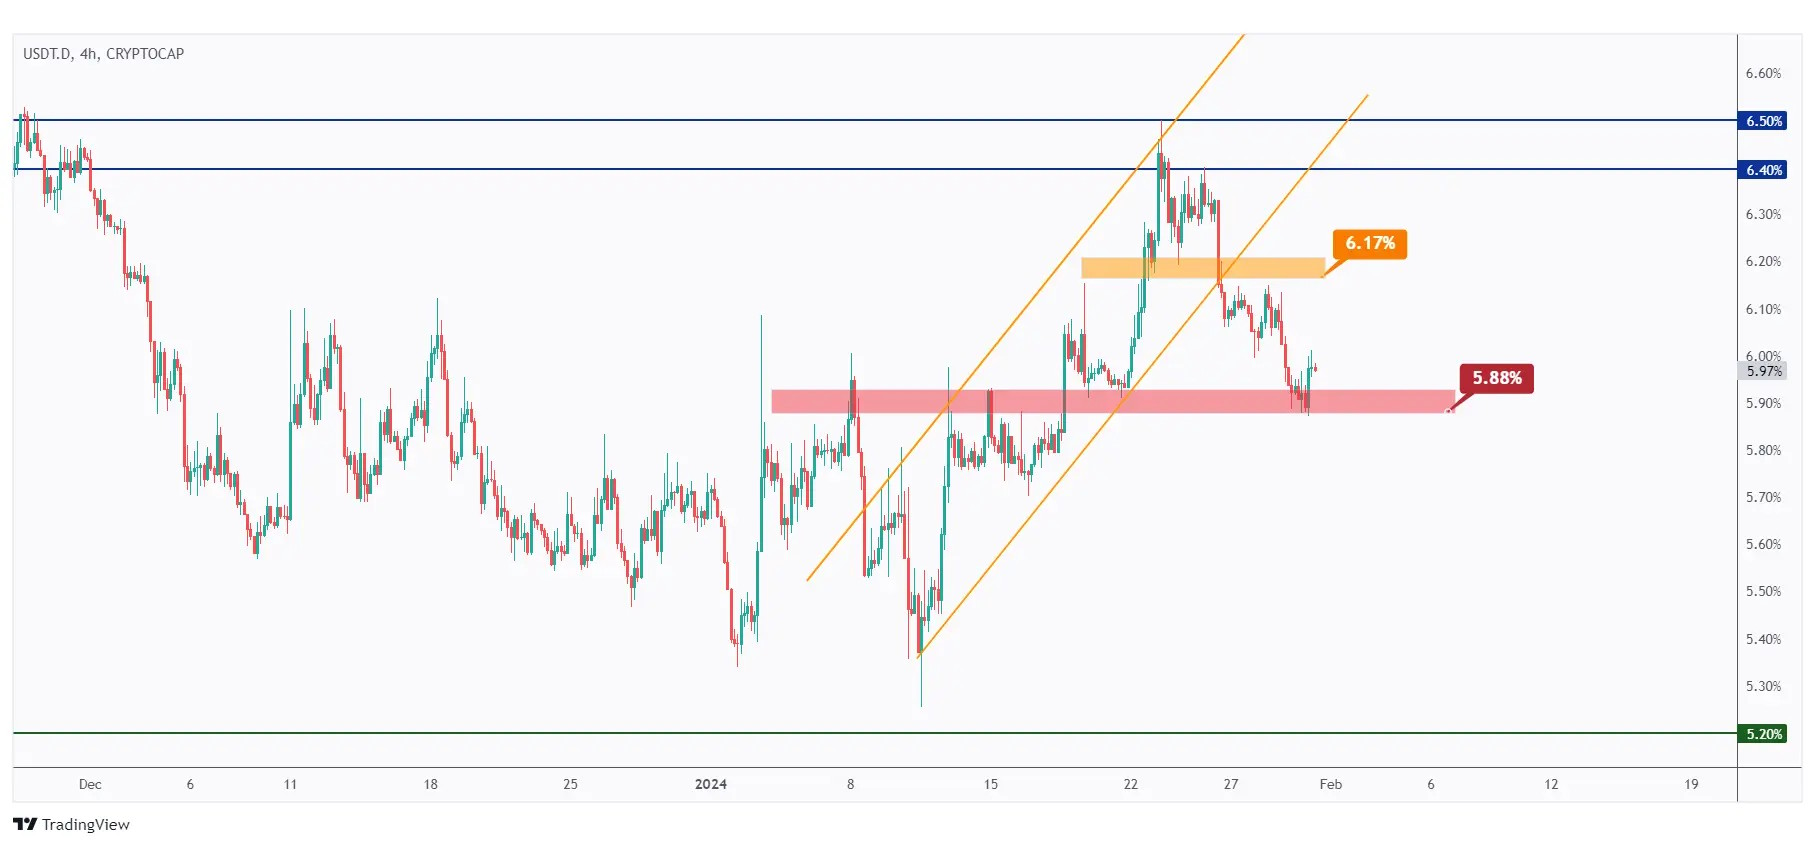
In the 4-hour timeframe, following our analysis from last week, the bears took over after breaking below the orange channel and the last low at 6.17%.
Currently, USDT.D is positioned around a major structure at 5.88%. If this level is breached downward, we anticipate further bearish movement towards the 5.4% demand zone.
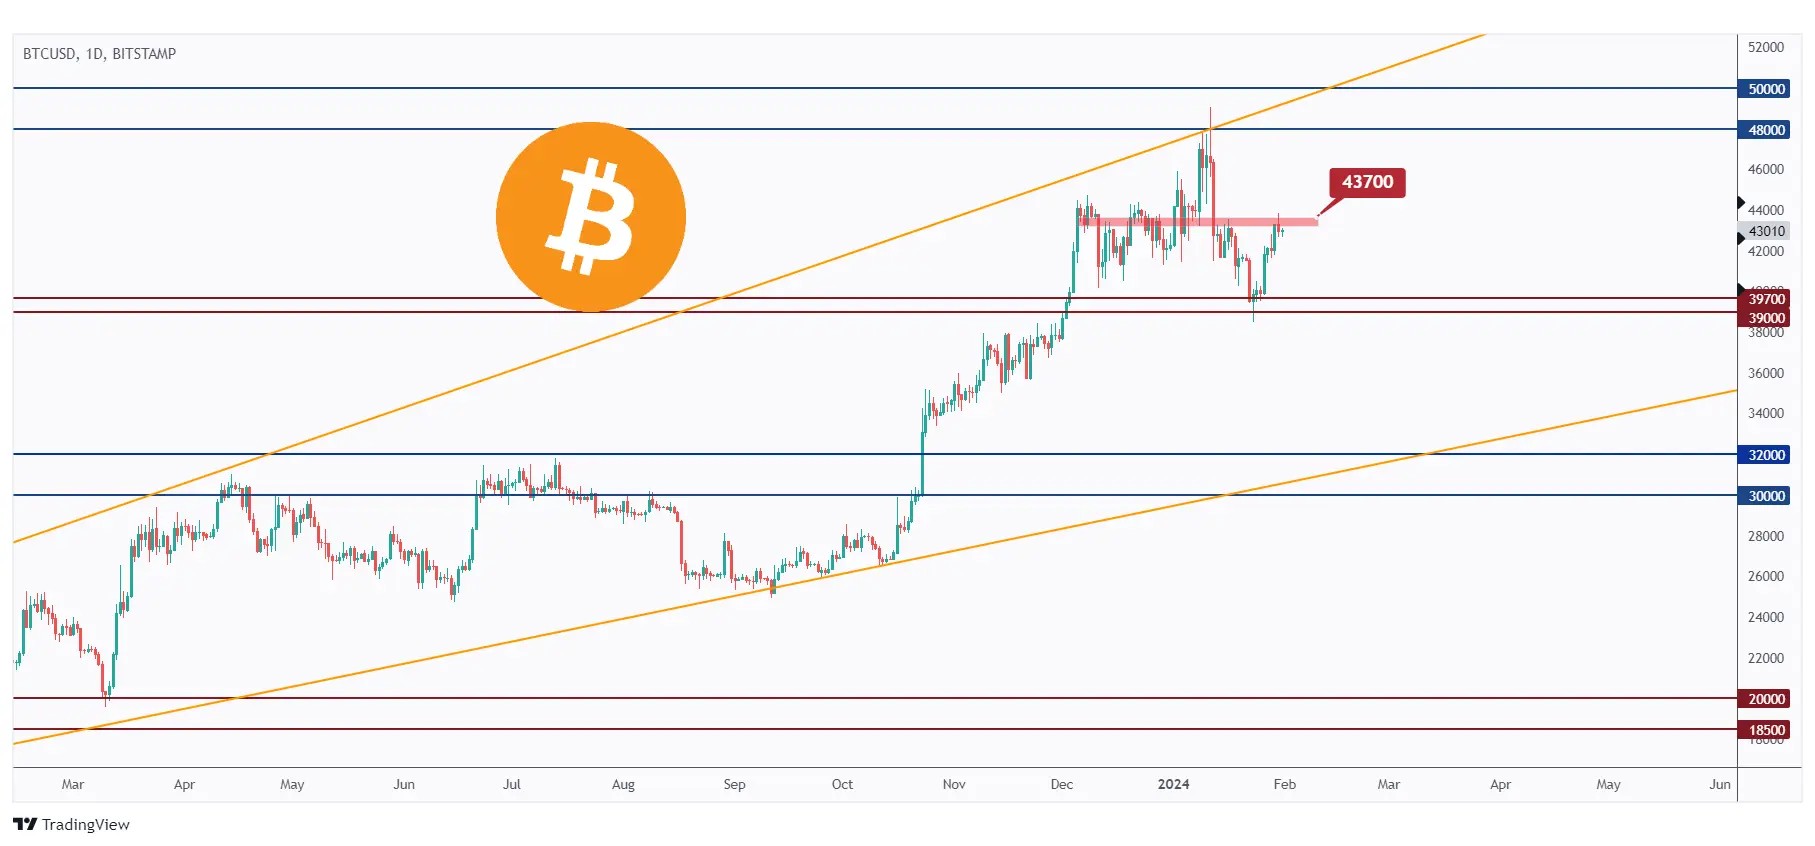
After rejecting the $39,000 support, BTC traded higher and is currently sitting around a major high in red at $43,700.
For the bulls to maintain control and push the price towards the $50,000 resistance, a breakout above the $43,700 level is required.
Meanwhile, BTC could still trade lower to test the $39,000 support again.
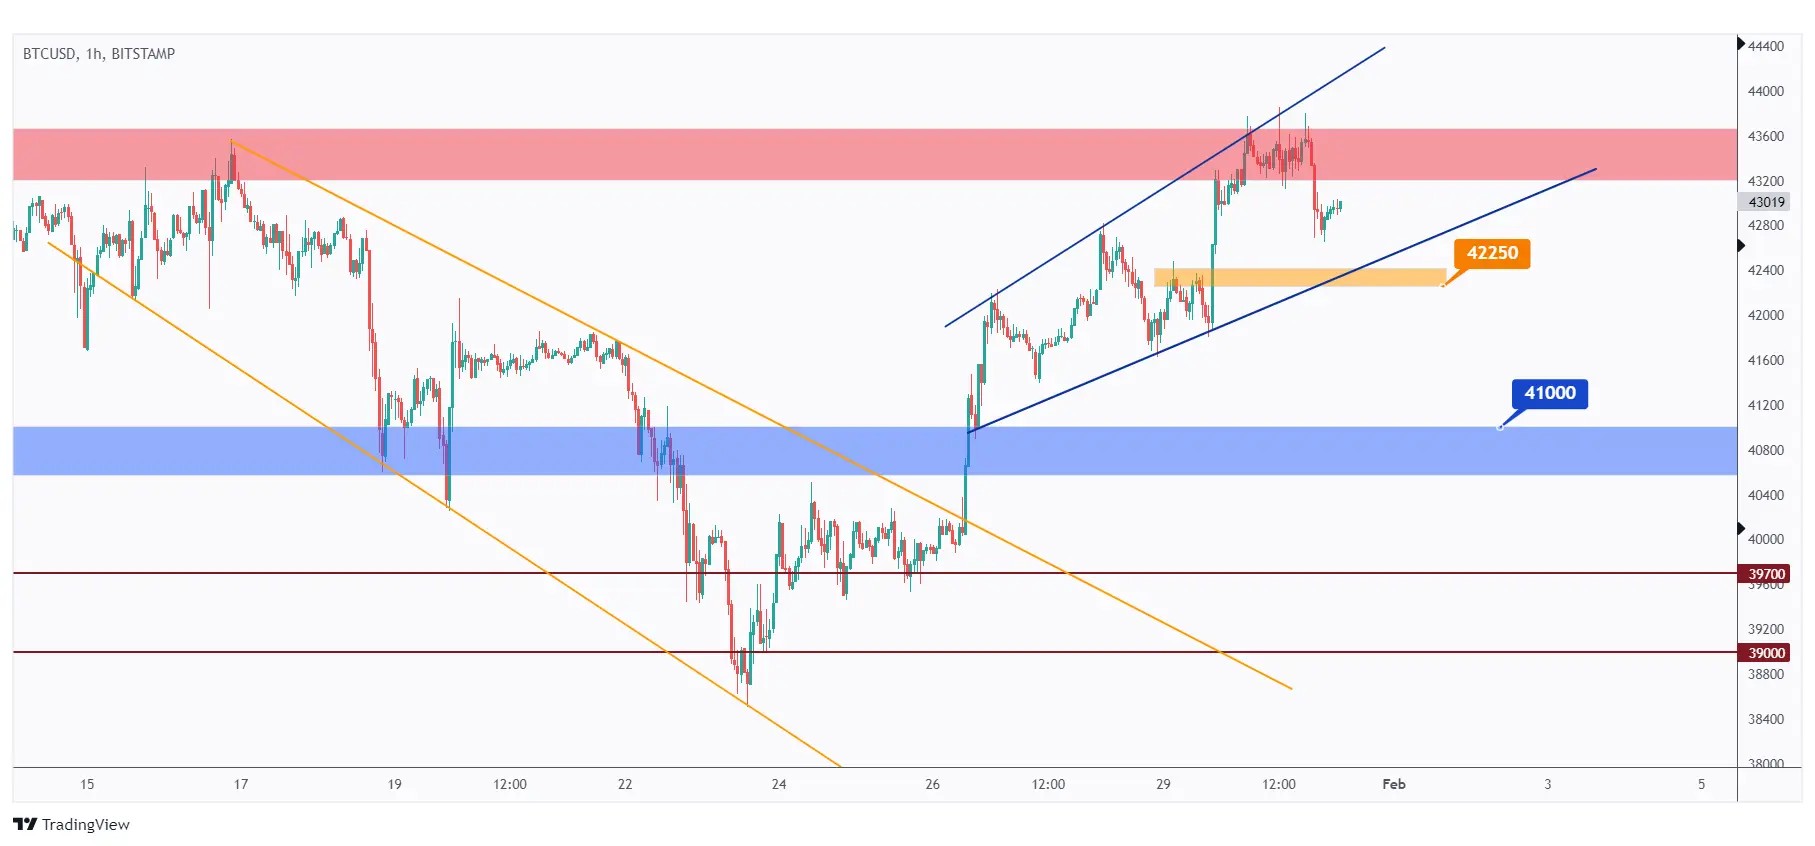
BTC has been bullish from a short-term perspective, trading inside the rising wedge pattern in blue.
The bulls will remain in control unless the lower blue trendline and the last low in orange at $42,250 are breached downward.
In this scenario, a movement towards the $41,000 support would be expected.
5 Altcoins Analysis
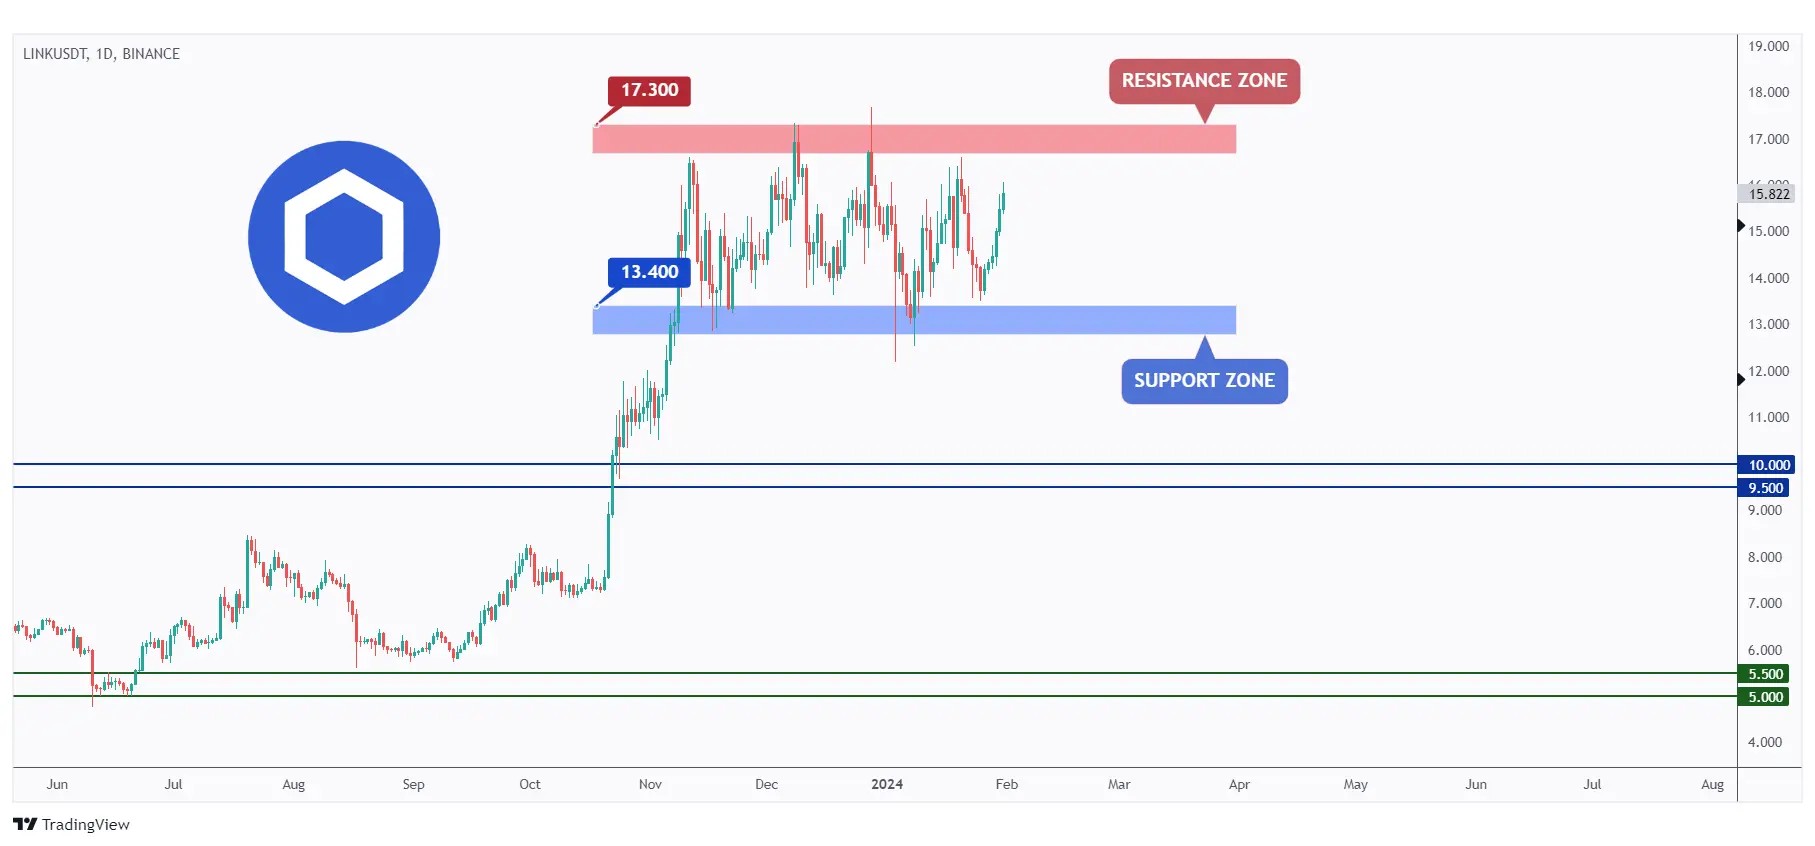
Let's start with LINK. It has been consolidating within a range for a couple of weeks, between our $13.4 support and $17.3 resistance.
As LINK retests the lower bound of the range, we will be looking for short-term buy setups on lower timeframes.
In parallel, for the bulls to take over from a long-term perspective, a breakout above the $17.3 resistance is needed.
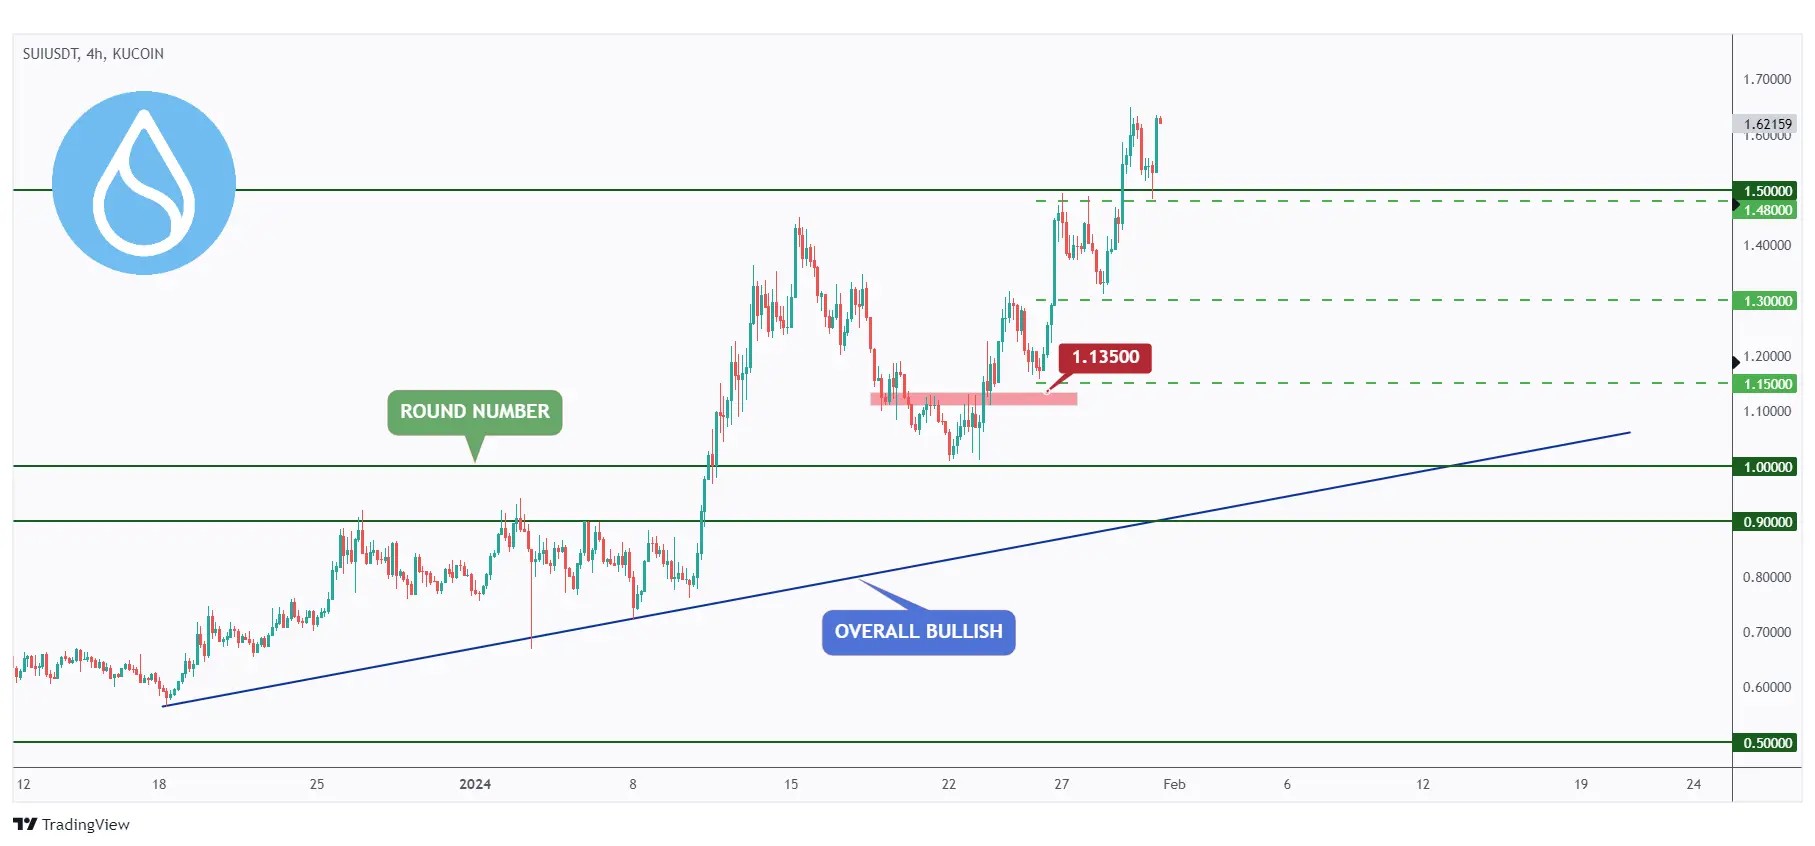
Turning our attention to SUI, following our last Coin of the Week article, SUI broke above our previous major high in red at $1.135 and traded higher, achieving all our targets marked in light green.
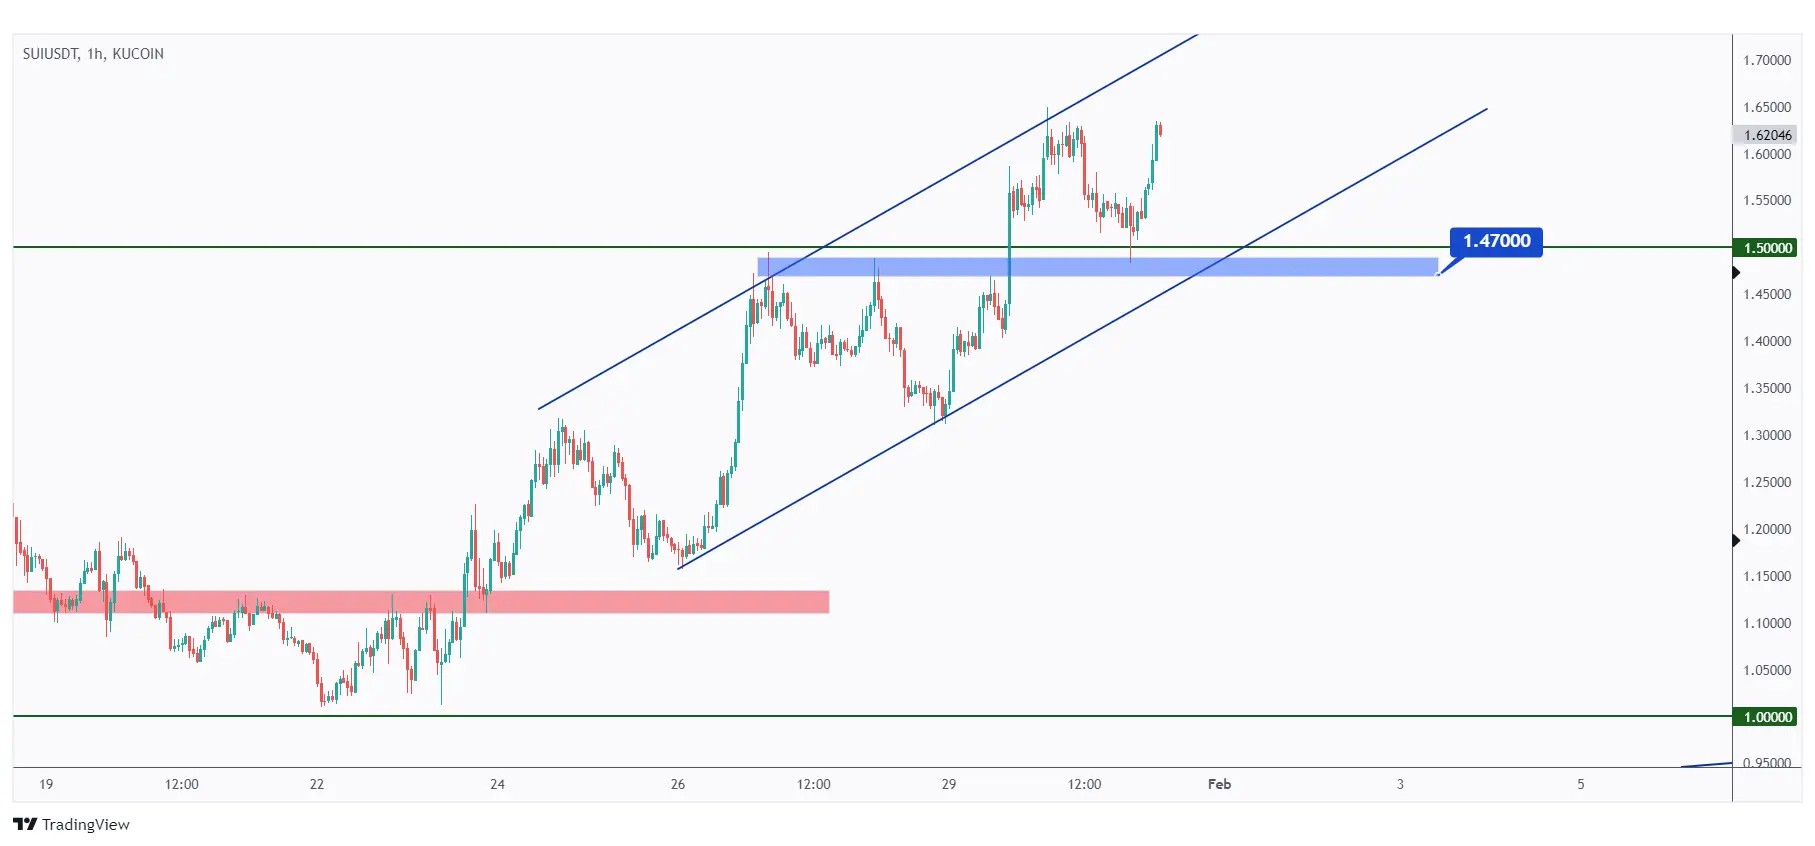
In the 1-hour timeframe, SUI will continue to display a bullish trend as long as it remains within the rising channel in blue.
For the bears to take over and shift the momentum from bullish to bearish, a breakout below the lower blue trendline and the last major low at $1.47 is needed.
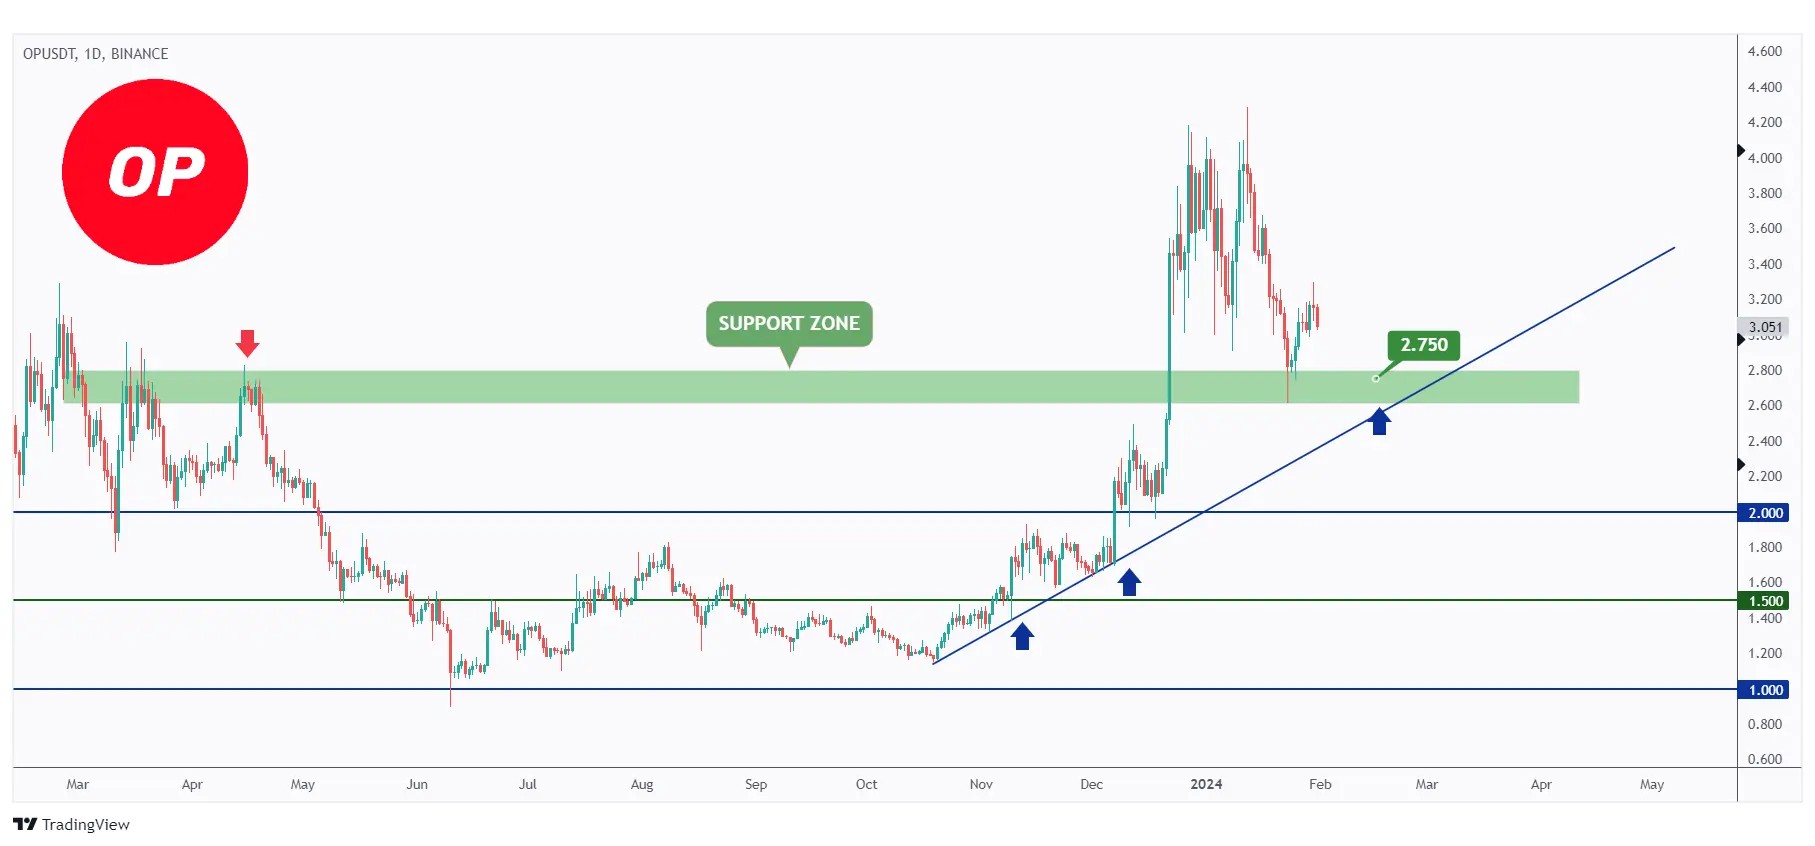
Next on the list for today is OP. It is currently bullish, trading above the blue trendline.
However, OP has recently entered a correction phase and is approaching a strong support level at $2.75.
As OP approaches the support zone, we will be actively monitoring lower timeframes for potential buy setups.
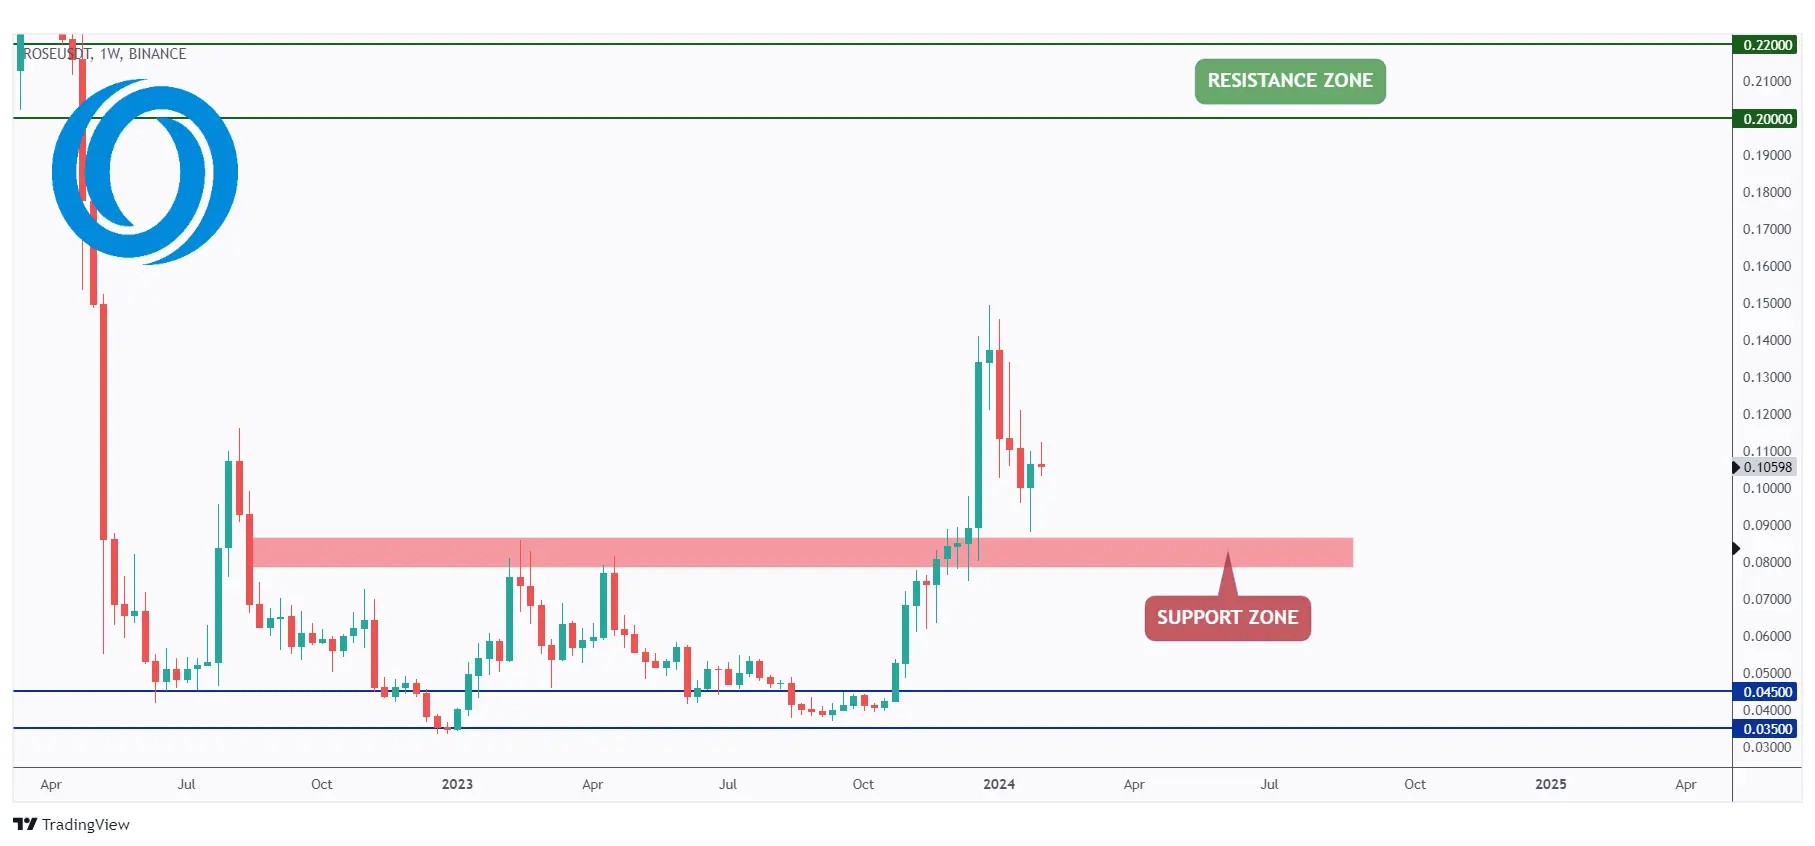
Analyzing ROSE, it has been overall bullish trend, recently breaking above the $1 round number.
Currently, ROSE is in a phase of retesting a support zone marked in red, leading us to look for trend-following buy setups on lower timeframes.
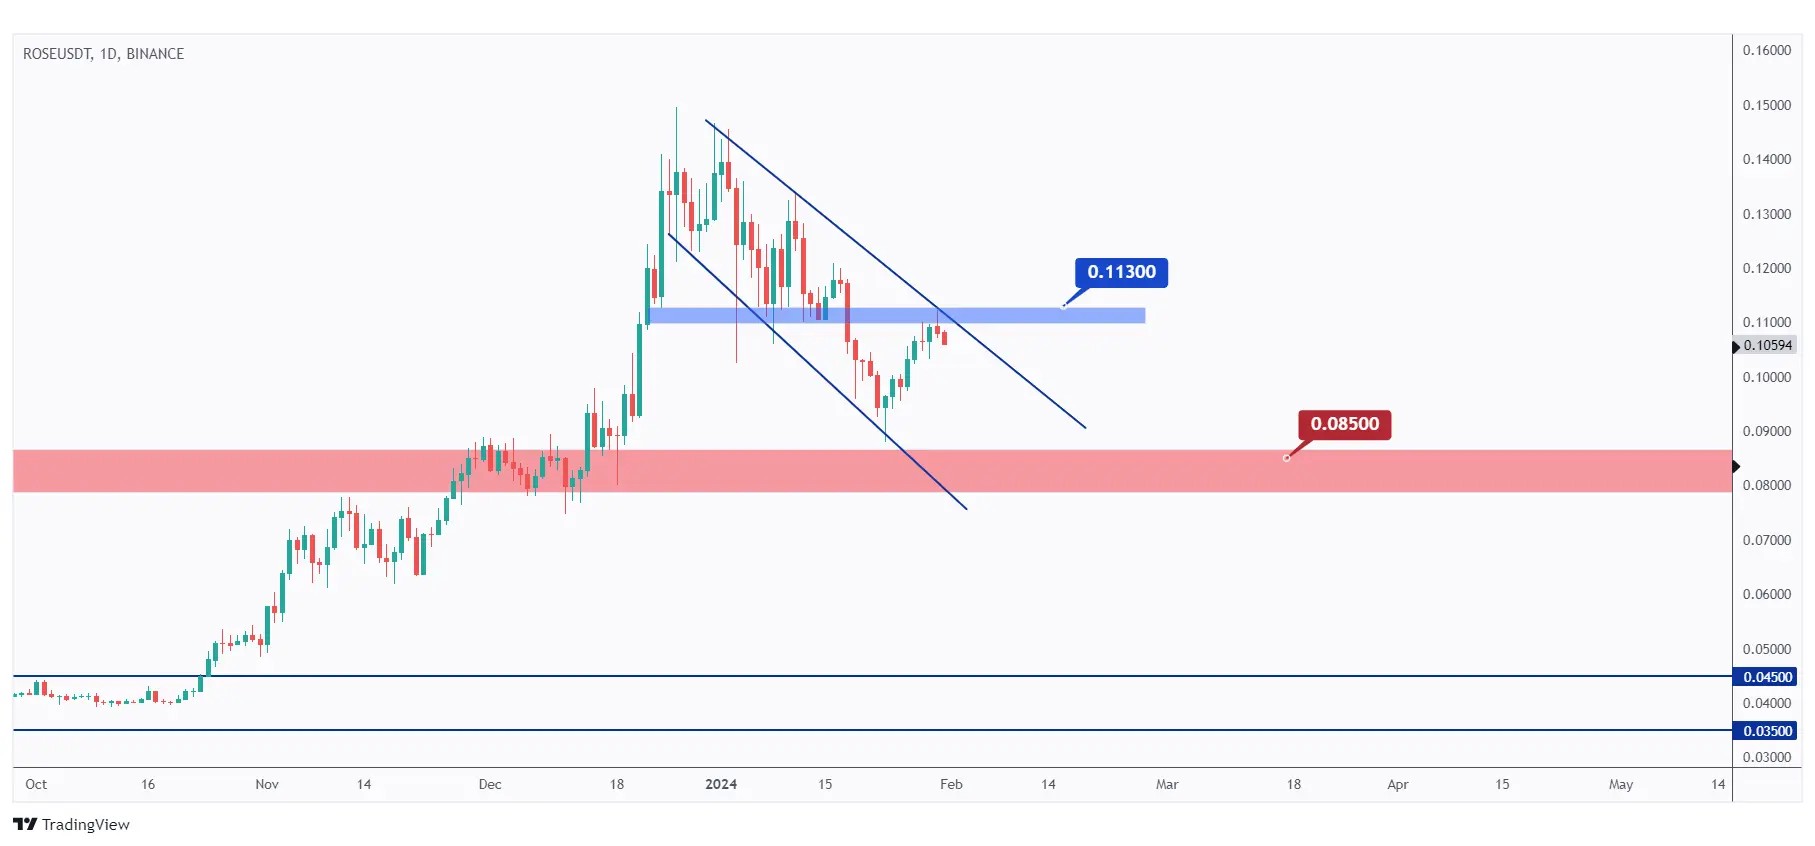
Examining the daily timeframe, ROSE has shown a bearish trend from a medium-term perspective, trading within the falling channel marked in blue.
For the bulls to assume control and initiate the next upward impulse movement, a breakout above the last major high at $0.113 is necessary.
Meanwhile, ROSE could remain bearish and potentially continue trading lower to test the weekly support at $0.085.
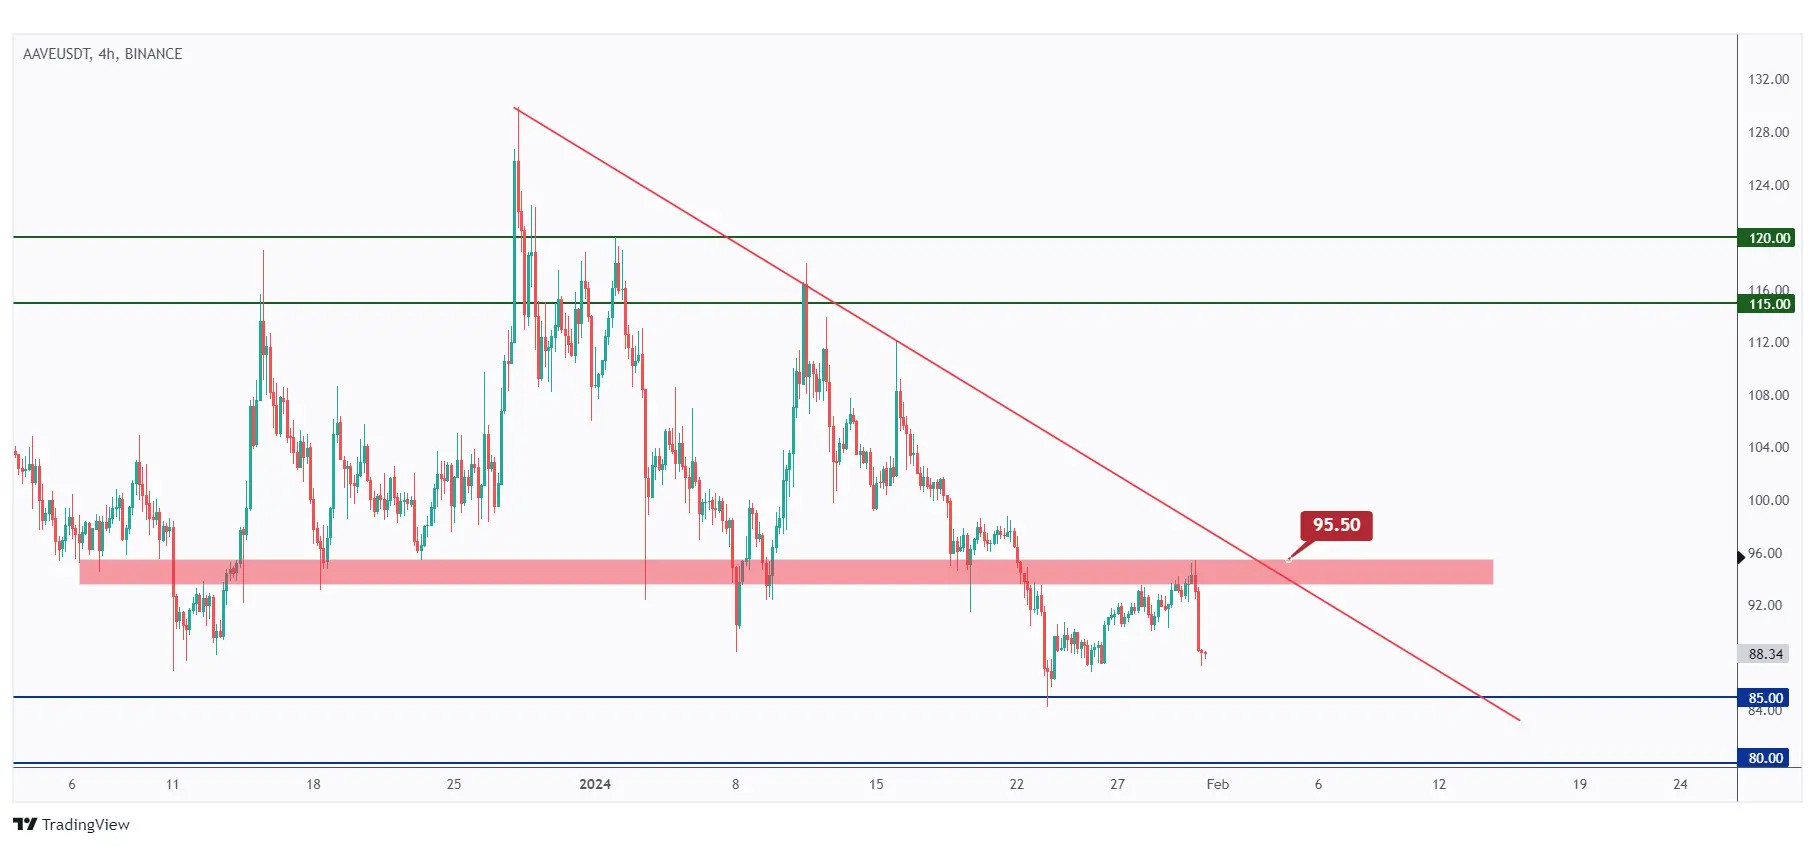
AAVE has been consolidating within a range between $80 and $120.
At present, AAVE is retesting the lower bound of the range and the support zone, hence we will be looking for potential buy setups on lower timeframes.
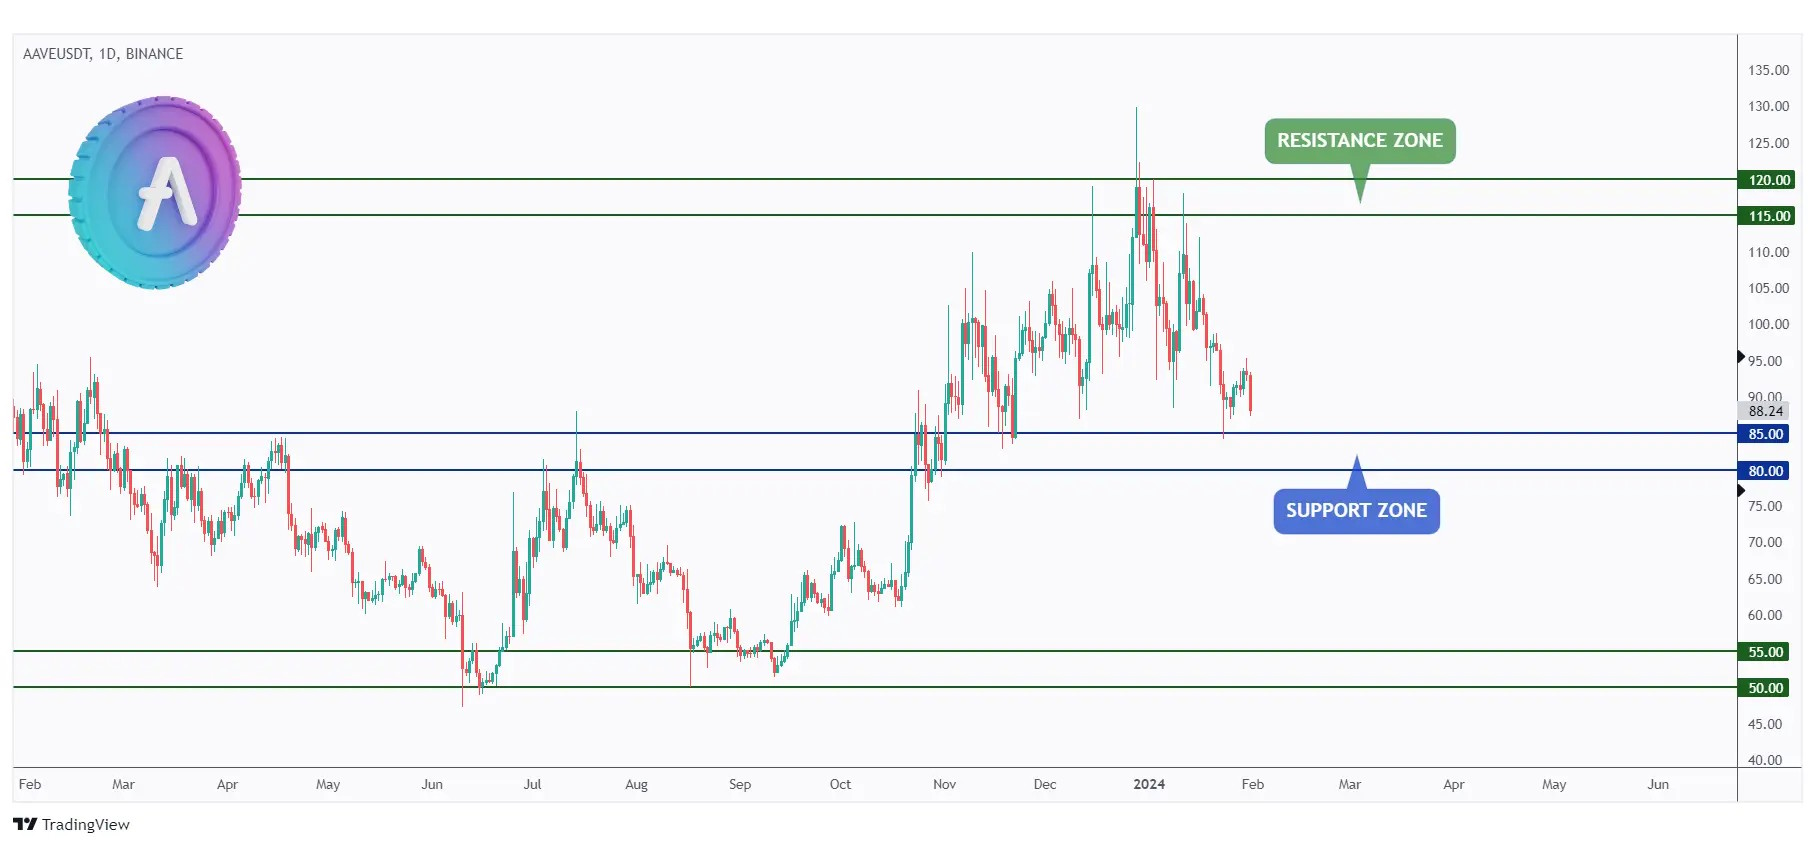
For the bulls to regain control and initiate the next upward impulse movement towards the $120 resistance, a momentum candle close above the last major high highlighted in red at $95.50 is necessary.
Quotes / Advices
Here are my 4 favorite trading quotes:
"The stock market is a device for transferring money from the impatient to the patient." - Warren Buffett
"In investing, what is comfortable is rarely profitable." - Robert Arnott
"The goal of a successful trader is to make the best trades. Money is secondary." - Alexander Elder
"The stock market is filled with individuals who know the price of everything, but the value of nothing." - Philip Fisher
Closing Remarks
In summary, the outlook begins with a focus on USDT.D, representing traders' sentiment.
The chart indicates a potential bullish movement if a support at 5.63% holds, impacting the overall crypto market sentiment.
BTC's daily chart notes a rejection at $39,000 support, requiring a breakout above $43,700 for bullish momentum.
Five altcoins are also analyzed:
LINK consolidates between $13.4 and $17.3, SUI displays bullish trends within a rising channel.
OP is bullish but approaching $2.75 support, ROSE is retesting a support zone and may turn bullish with a breakout.
AAVE consolidates between $80 and $120, with potential buy setups near the lower bound.
Key support and resistance levels are highlighted for each altcoin.