
elcome to another crypto market outlook for the 28th of January!
In this edition, we'll delve into major assets such as US500, DXY, Gold, Bitcoin, and Ethereum, highlighting critical levels and potential trade setups.
From Bitcoin experiencing a ranging week around support to ETH remaining overall bearish, and the Fear & Greed Index signaling "Neutral" after a couple of months of "Greed" sentiment, this article covers it all.
Are you ready?
Today, we will cover the following topics:
- Market Heatmap and Fear and Greed Index
- US500, DXY and Gold Analysis
- USDT.D, Bitcoin and Ethereum Analysis
- Quotes / Advices
- Closing Remarks
Market Heatmap and Fear and Greed Index
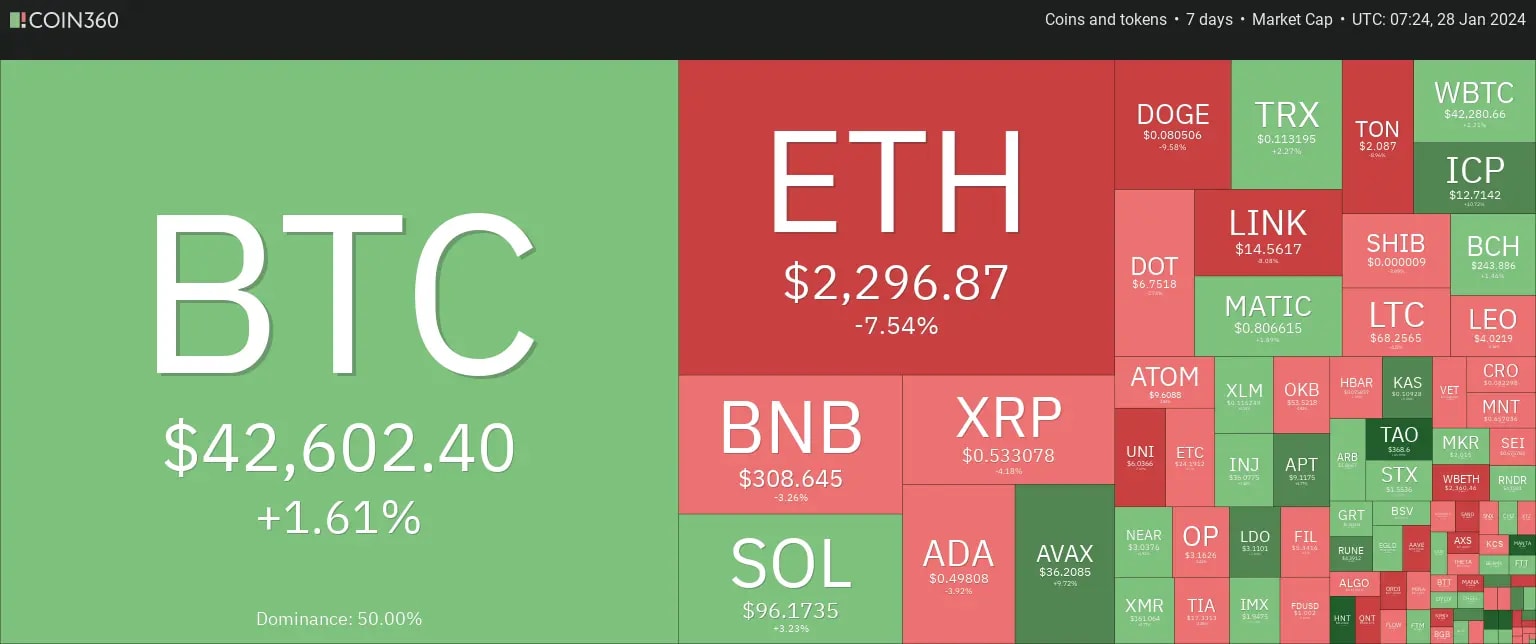
To initiate my research, I delved into the analysis by examining the market heatmap, which provided a comprehensive overview of the entire cryptocurrency market.
After rejecting the $40,000 support zone, BTC rose by 1.6%, dragging the many altcoins up with it.
On the heatmap, you can observe a mix of red and green colors. Despite the bullish movement at the end of the week, some altcoins have sustained a bearish trend on average over the past 7 days, with ETH still down by 7.54%.
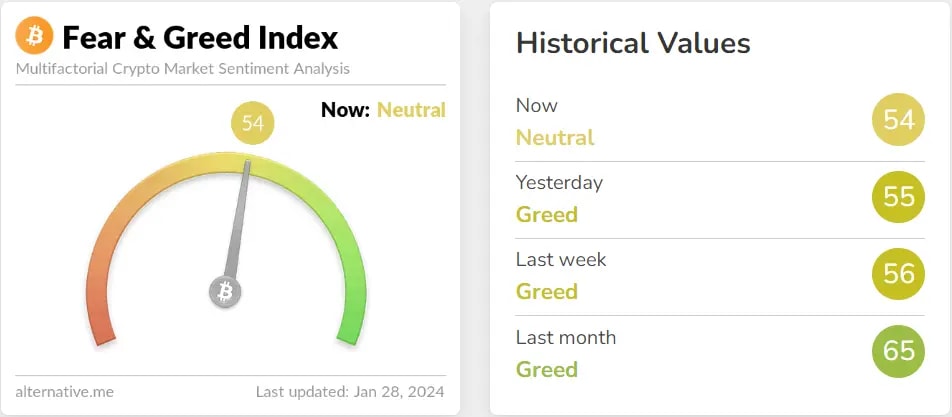
The Fear & Greed Index has shifted to "Neutral" after nearly two months of "Greed" sentiment. This indicates that traders are becoming less optimistic, signaling a correction in the crypto space.
US500, DXY and Gold analysis
We consistently monitor the US500 index to assess the current market sentiment. This practice is crucial because the cryptocurrency market often exhibits a significant correlation with the stock market, and this interconnection can impact its fluctuations.
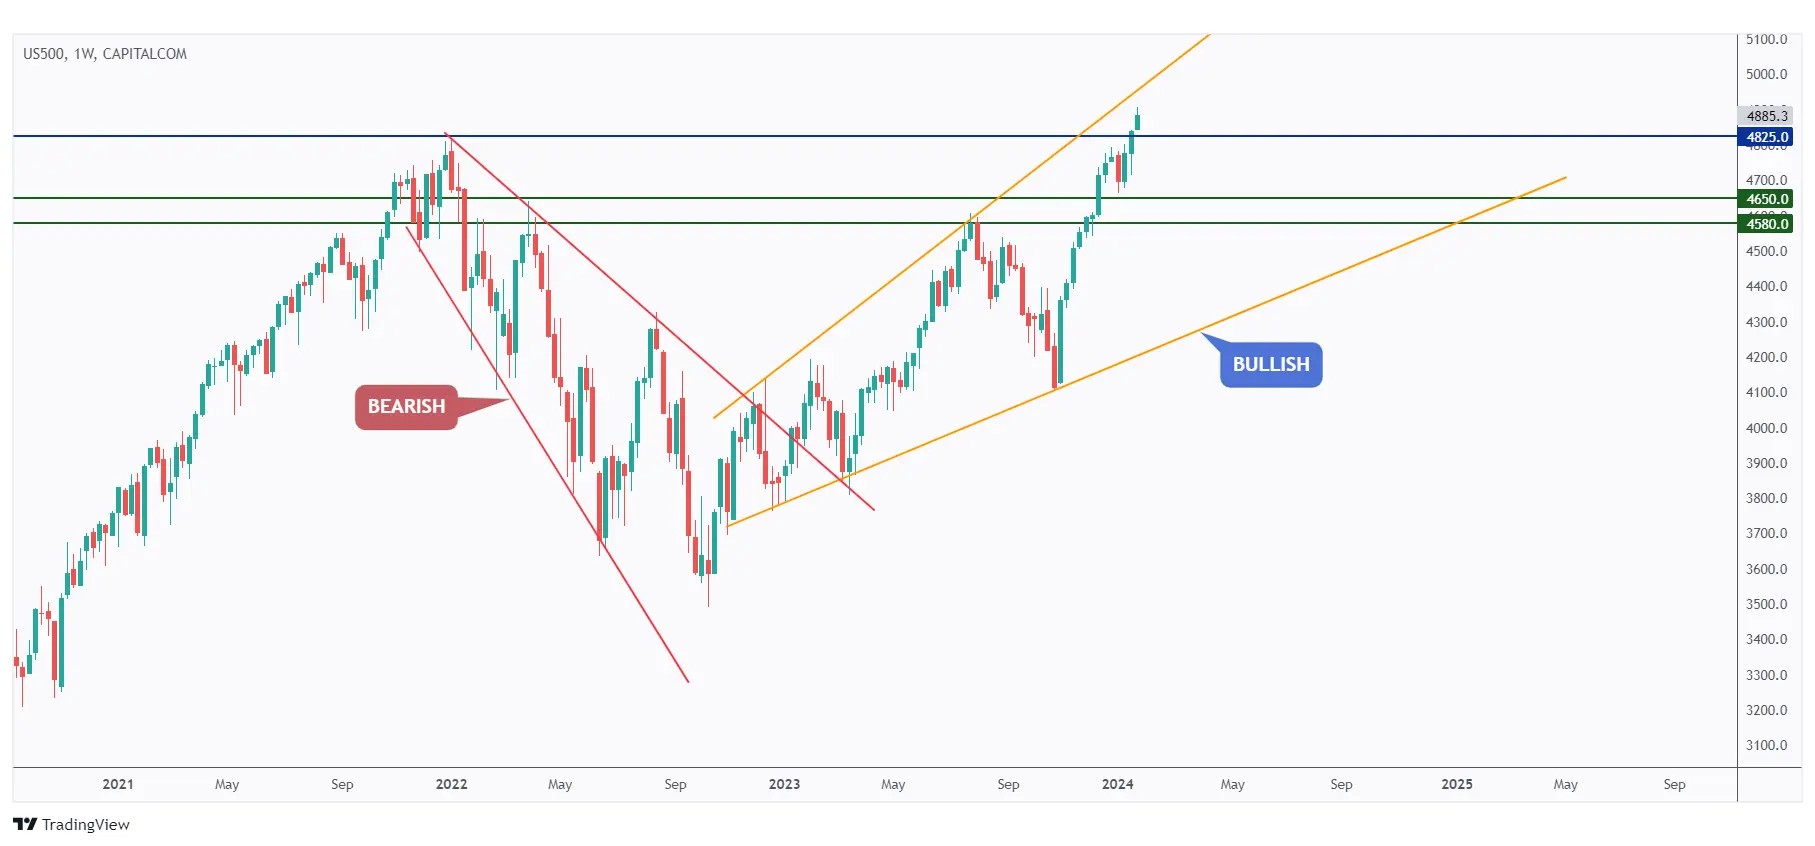
After breaking above the previous all-time high at $4825, US500 continues to display an overall bullish trend, establishing new all-time highs.
However, it is currently approaching the upper boundary of the orange wedge channel, which could serve as a potential non-horizontal resistance.
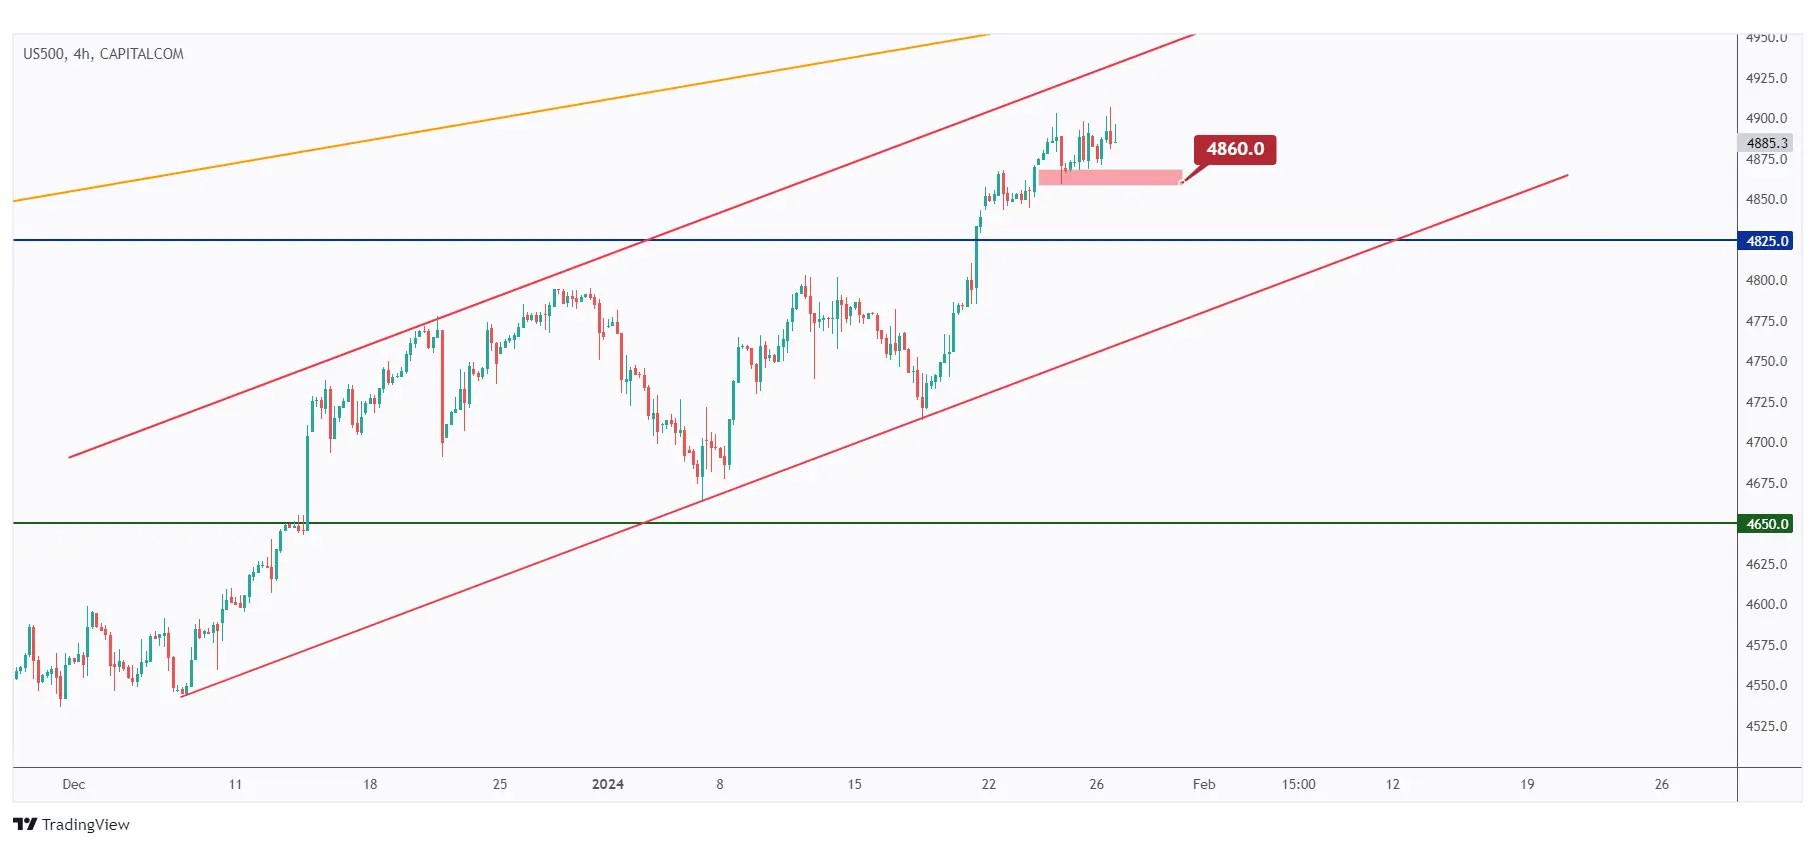
In the 4-hour timeframe, the expectation is for the bulls to sustain control as long as US500 is trading within the rising channel marked in red.
For the bears to take over from a short-term perspective, a break below the last low in red at $4860 is required. In such a scenario, a movement towards the lower trendline of the red channel would be anticipated.
We consistently monitor the DXY - USD Index as part of our routine analysis. This is crucial because the value of nearly all assets, including BTC/USD, is closely tied to the USD, which serves as the benchmark currency in the financial market.
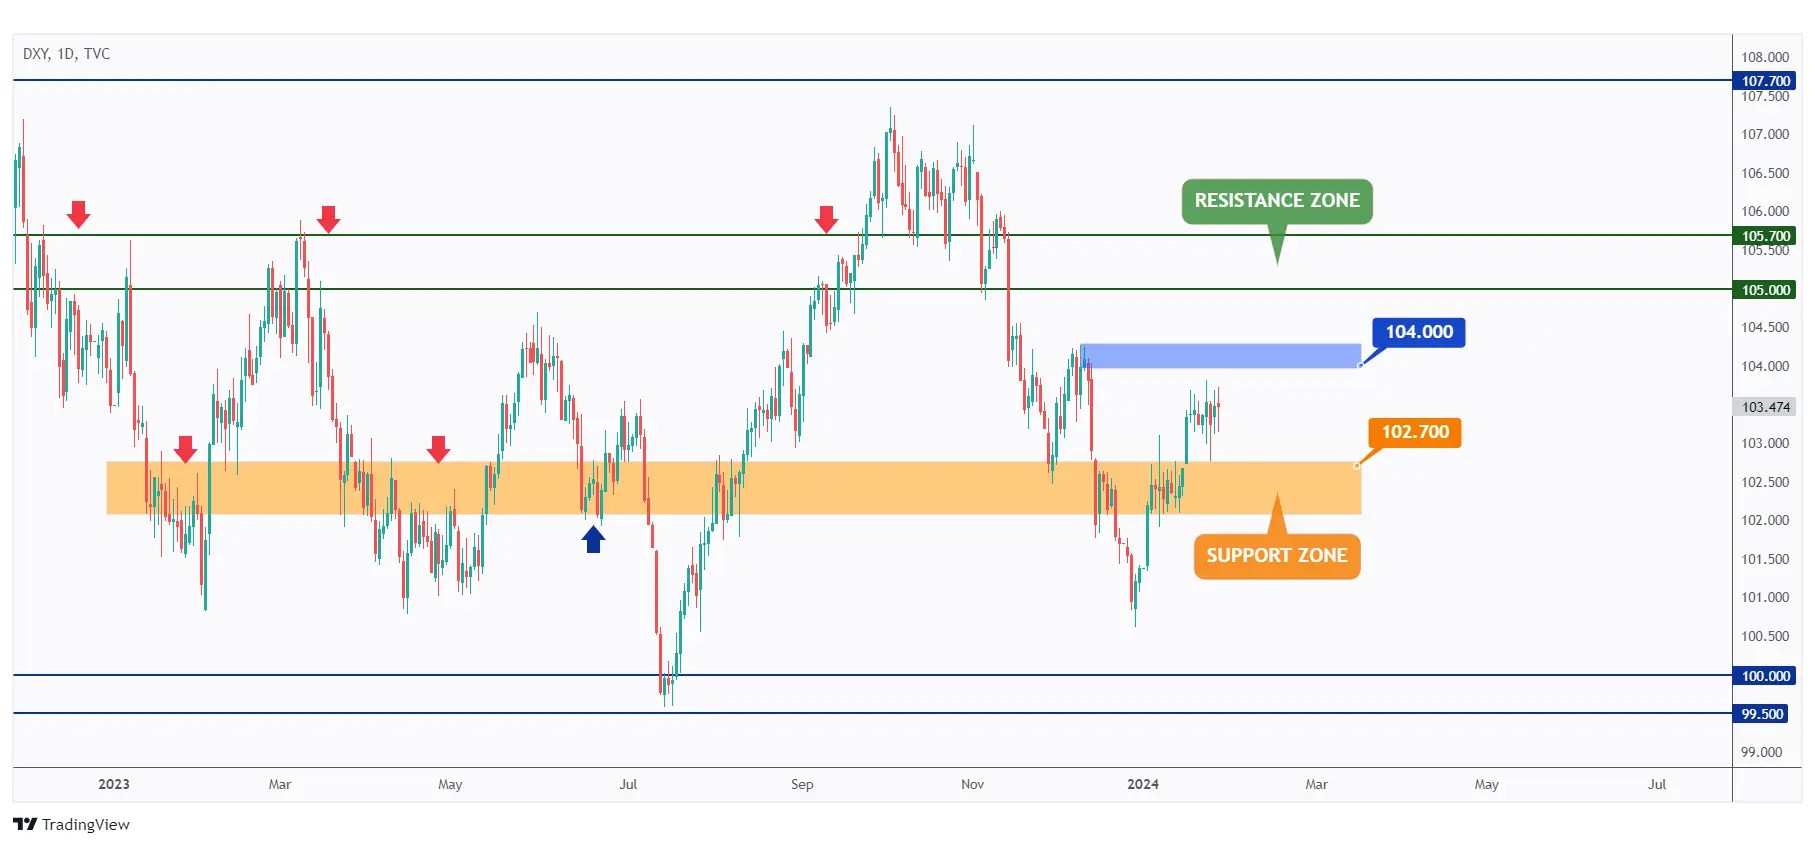
After breaking above the $102.7 resistance, DXY traded higher and is currently approaching a supply zone at $104.
As long as the $102.7 support zone holds, we will actively look for trend-following buy setups on lower timeframes.
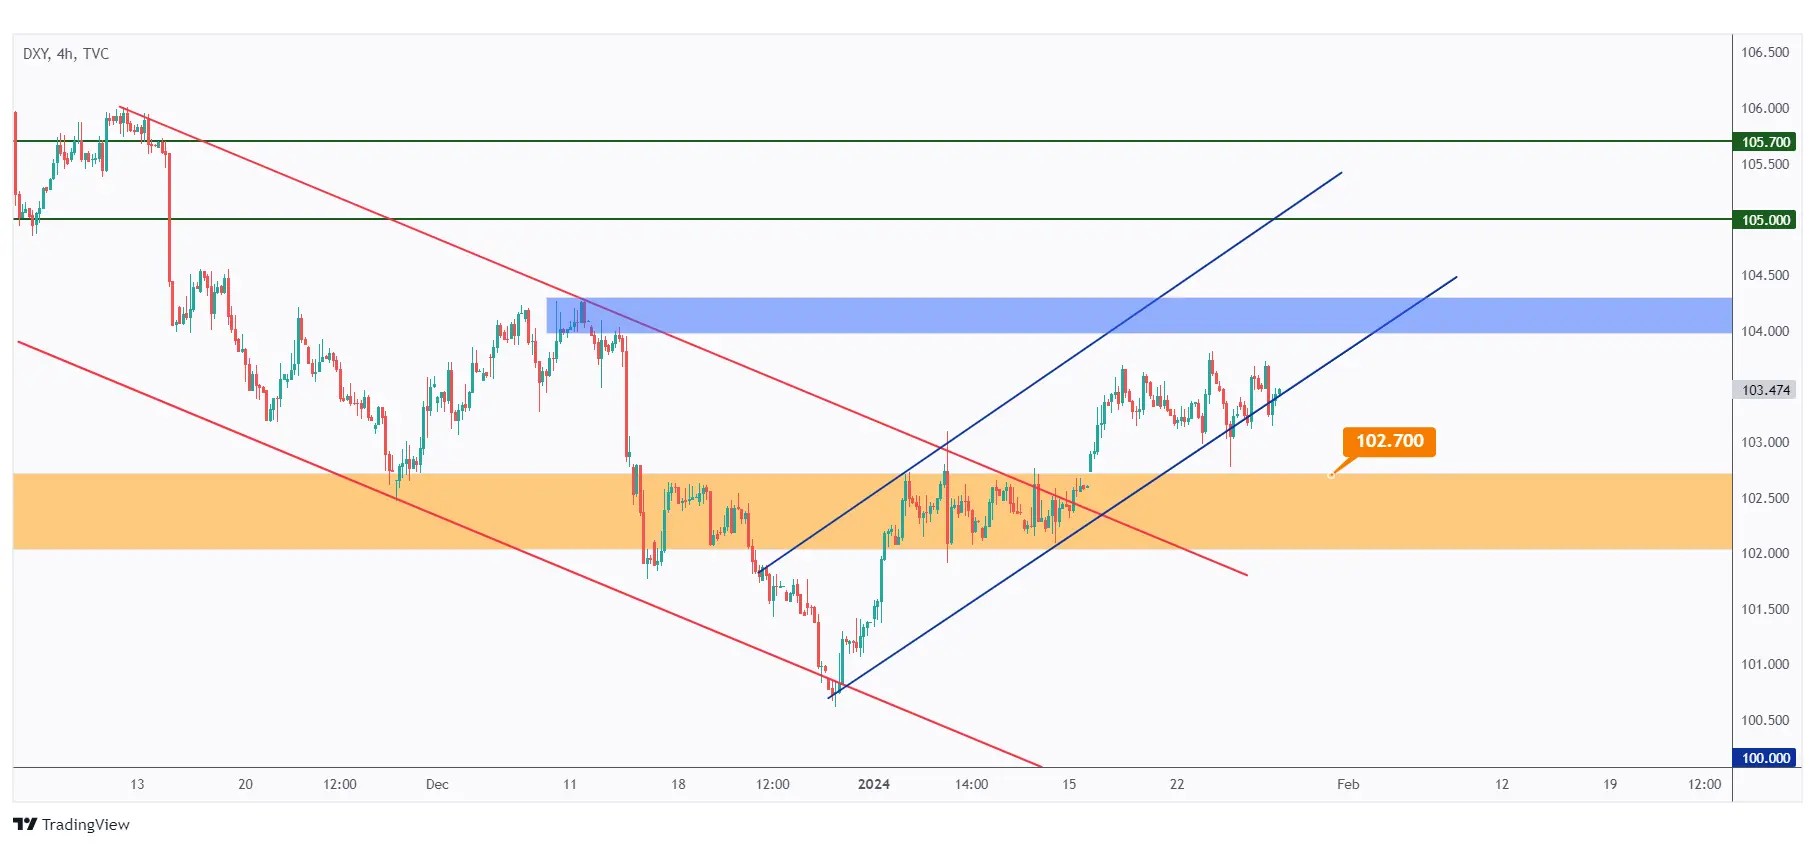
In the 4-hour timeframe, it is evident that the momentum has shifted from bearish to bullish, and DXY is currently trading within the rising channel in blue.
Since the DXY is hovering around the lower bound of the blue channel, we will actively seek trend-following buy setups on lower timeframes, anticipating an impulse movement towards the $104 resistance.
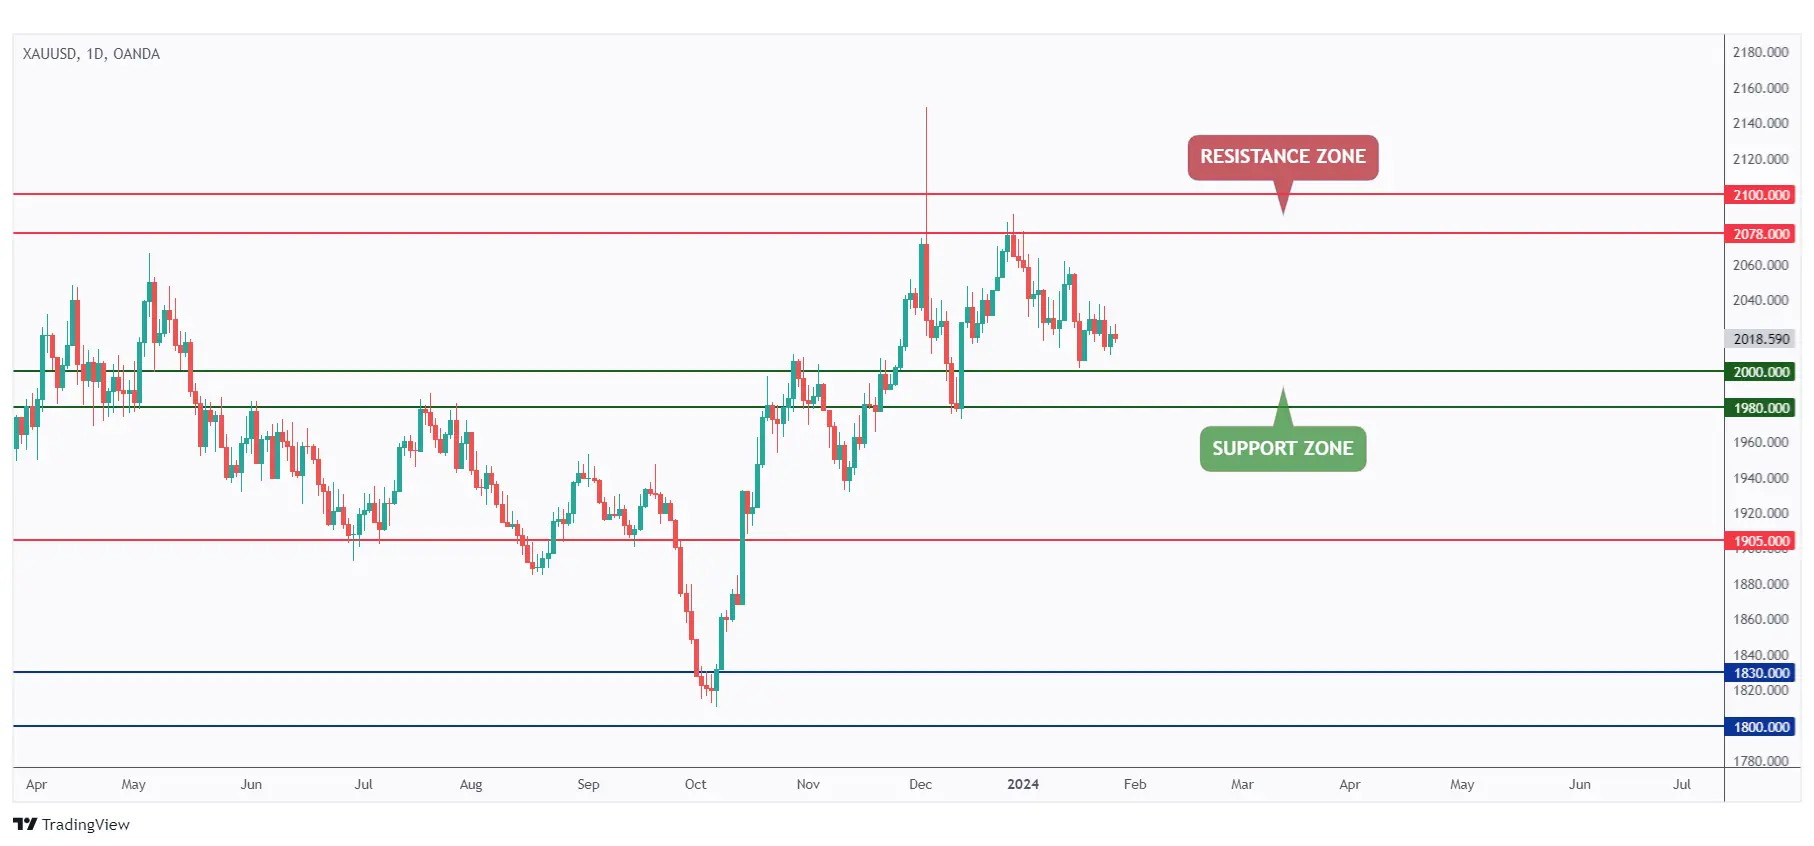
Gold has been trading within a range, between the $2000 support and $2100 resistance.
Currently, Gold is approaching the lower bound of the range, so we will actively look for buy setups on lower timeframes.
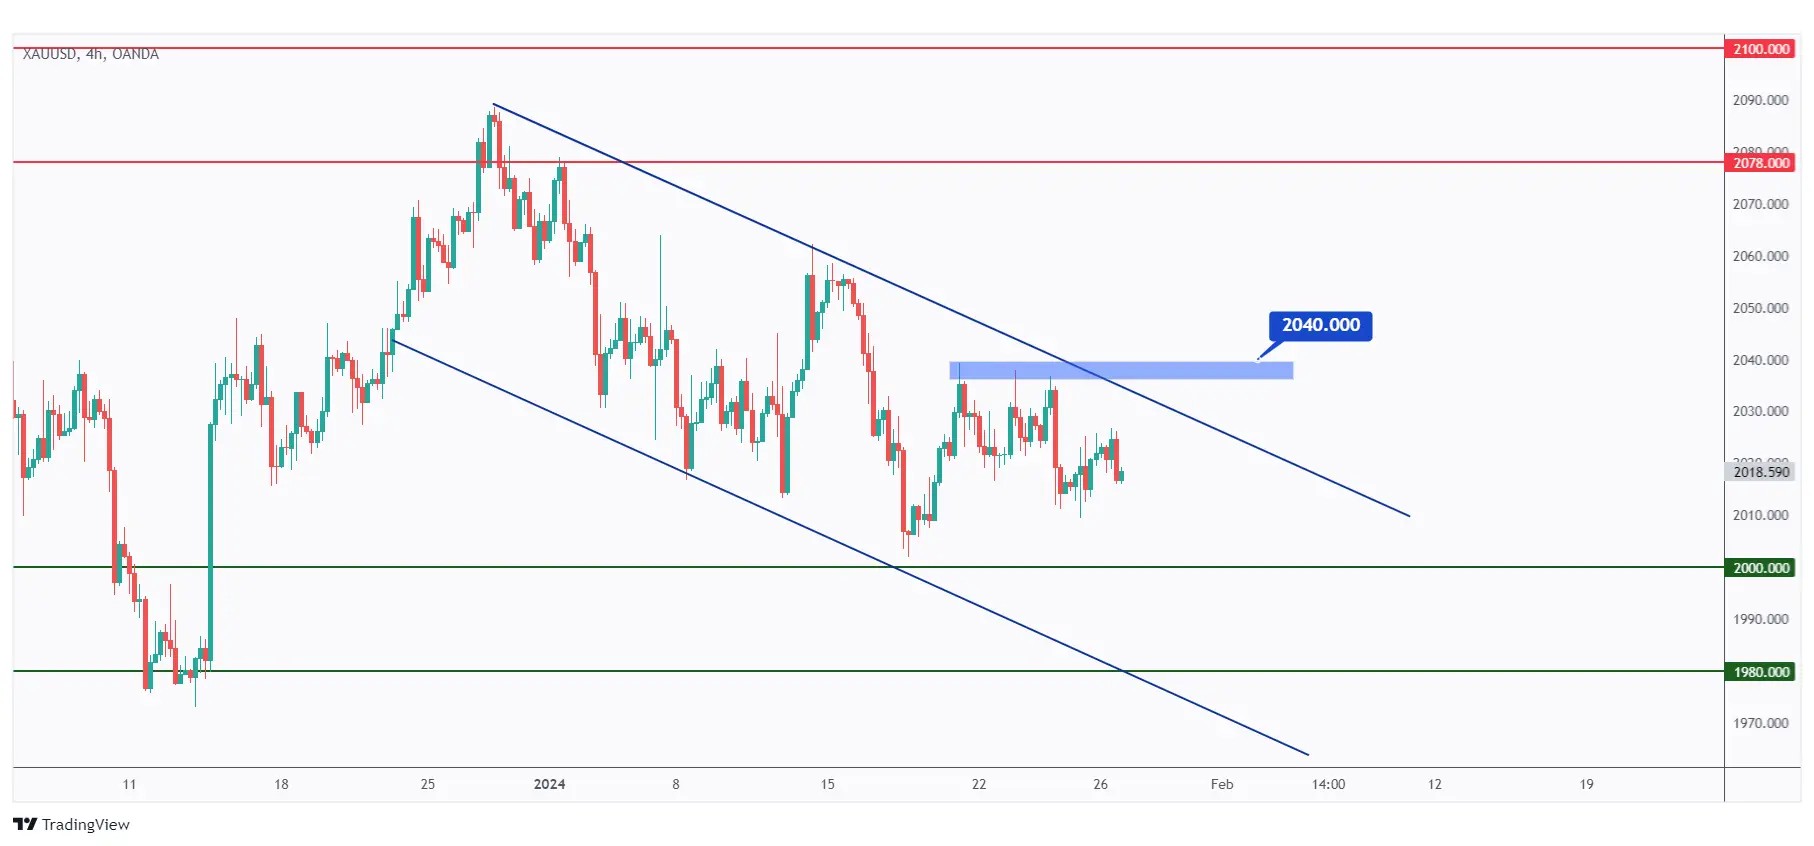
In the 4-hour timeframe, Gold has shown a bearish trend from a medium-term perspective, trading within the falling channel in blue.
For the bulls to take control and move the price towards the $2100 resistance, a breakout above the last major high in blue at $2040 is required.
Meanwhile, Gold will continue in its bearish direction, and a movement towards the $2000 support would be anticipated. In this scenario, we will actively look for new short-term buy setups.
USDT.D, Bitcoin and Ethereum analysis
As a standard practice, I commence my analysis with USDT.D as it serves as a crucial indicator of traders' sentiment. USDT.D offers valuable insights into whether traders are optimistic, signaling increased investment in cryptocurrencies, or pessimistic, indicating a shift towards stablecoins.
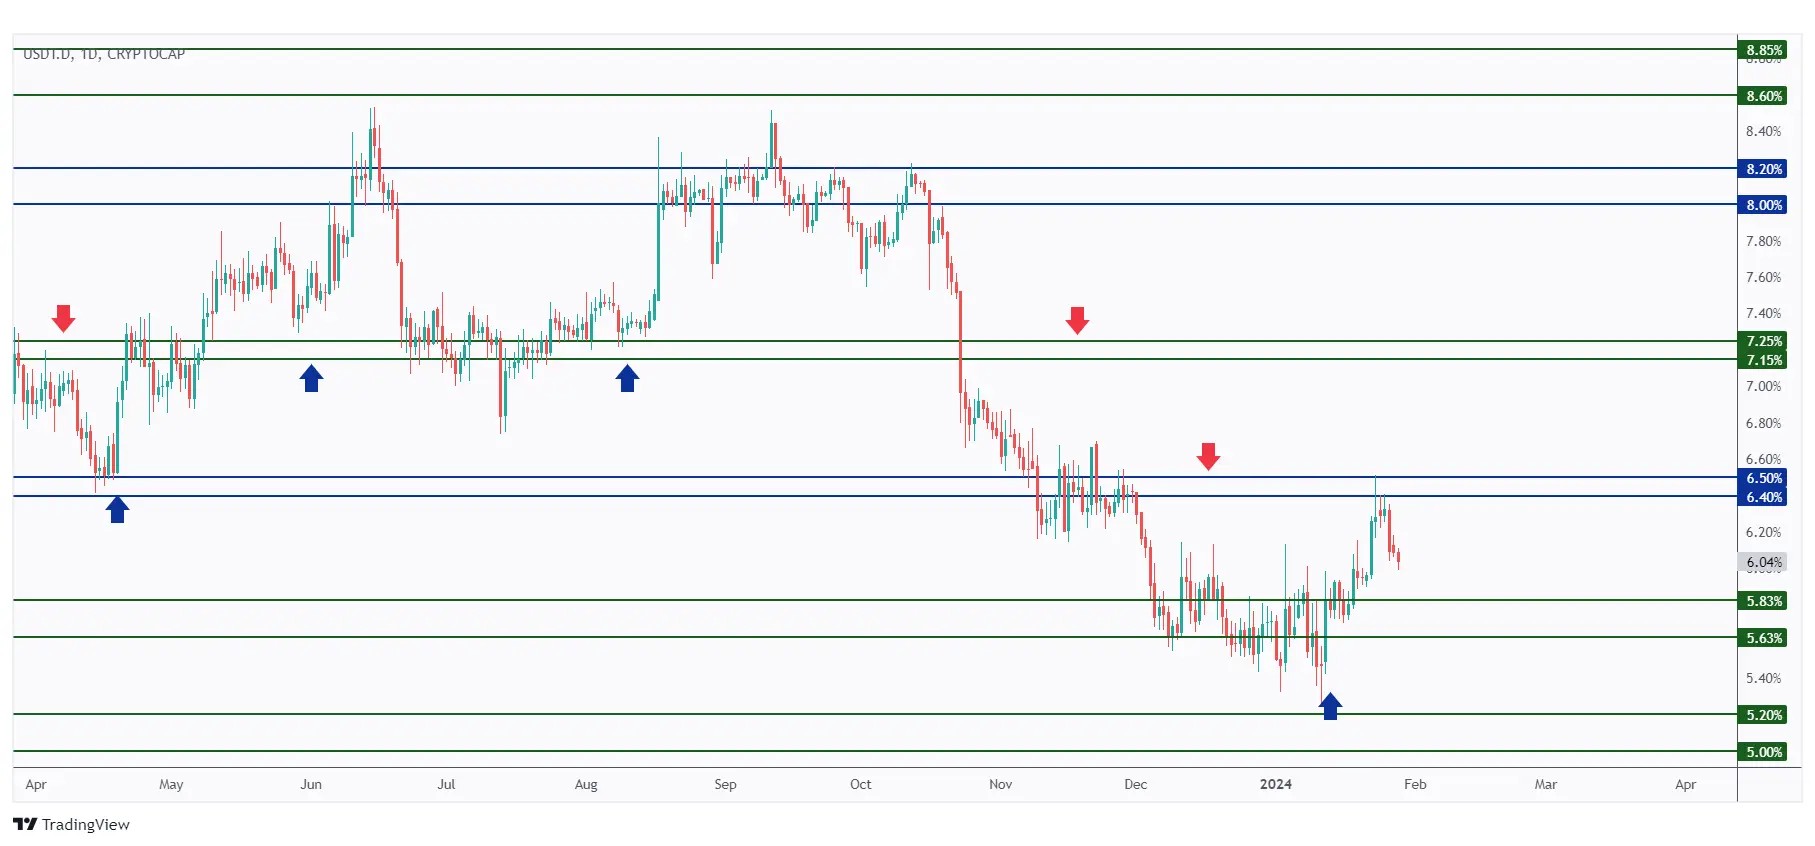
USDT.D has rejected the 6.5% resistance and is currently trading lower.
As it approaches the 5.83% support, we anticipate the bulls to take action, which would be negative for the overall crypto market sentiment.
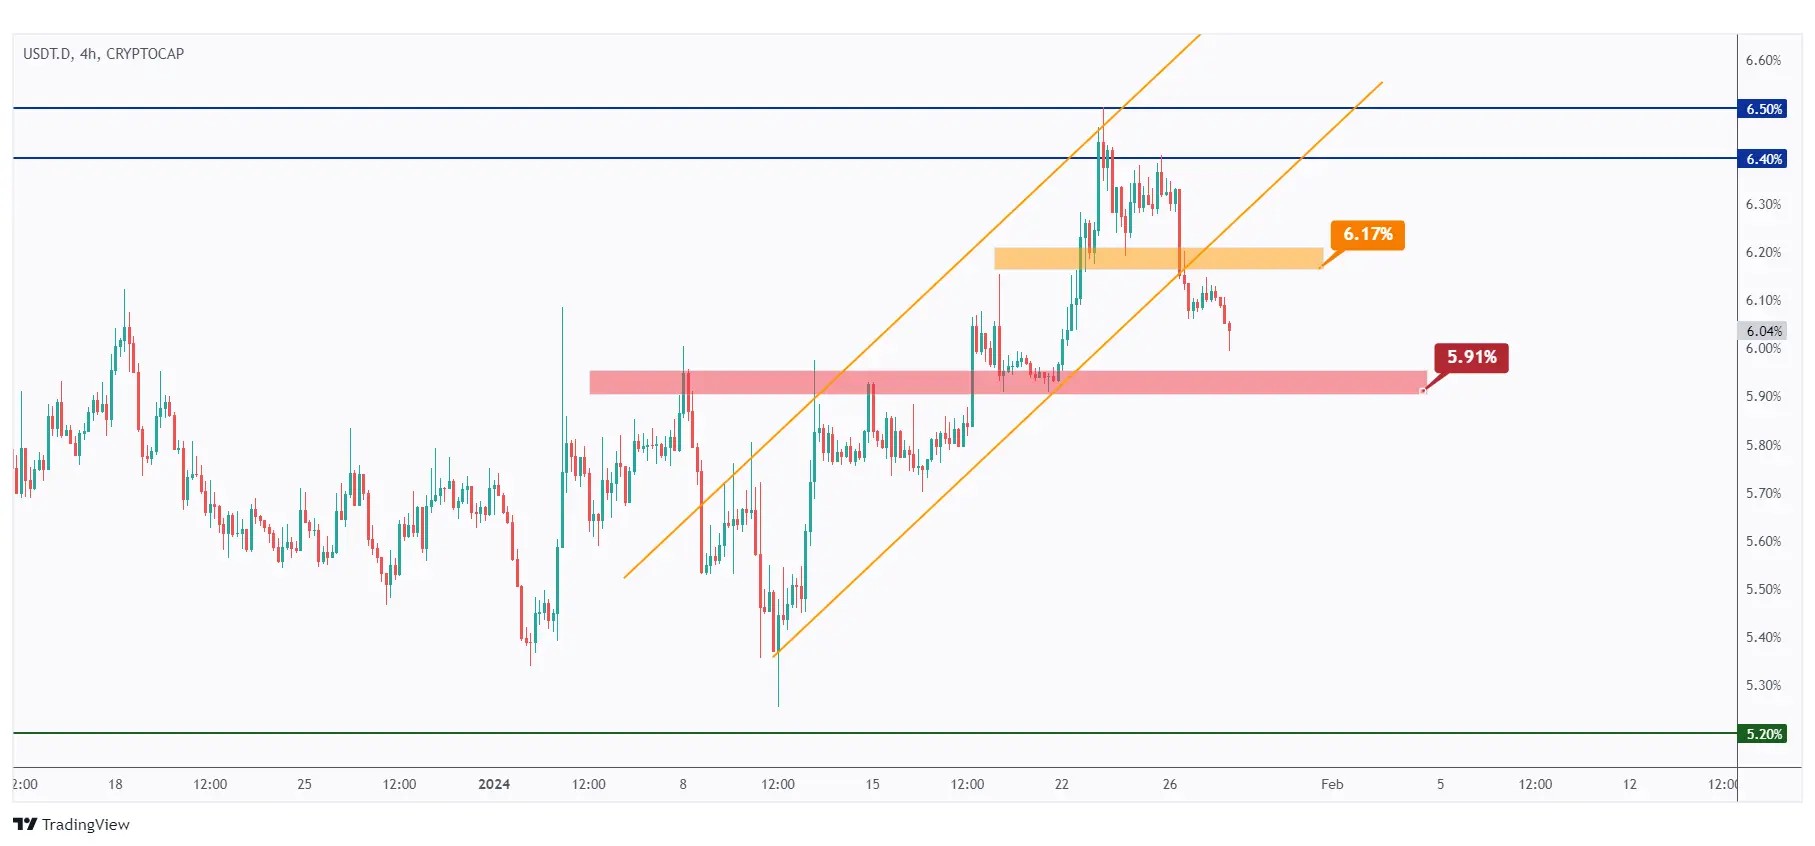
In the 4-hour timeframe, in line with our analysis from last week, USDT.D has broken below the previous major low at 6.17% and is trending lower.
Currently, it is approaching a robust structure at 5.91%. If this local support is breached downward, we anticipate further bearish movement towards the 5.5% demand zone, which would have a positive impact on the crypto market.
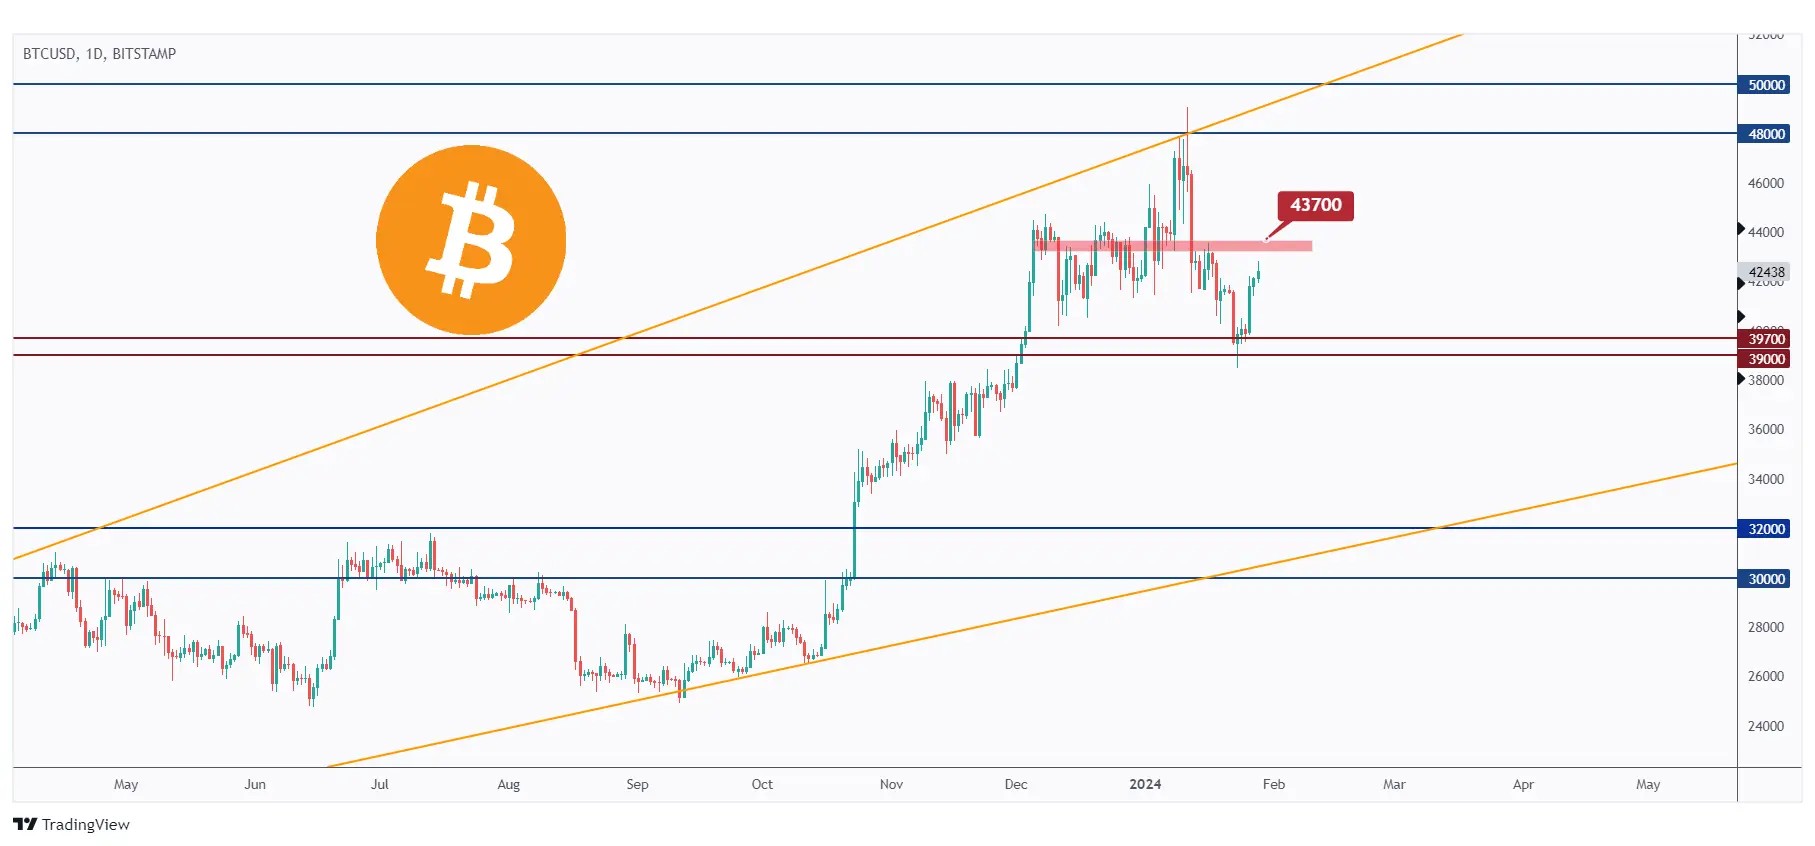
This week, BTC rejected the $39,000 support zone and is currently trading higher.
For the bulls to maintain control and have the opportunity to test the $50,000 resistance zone again, a breakout above the previous major high at $43,700 is needed.
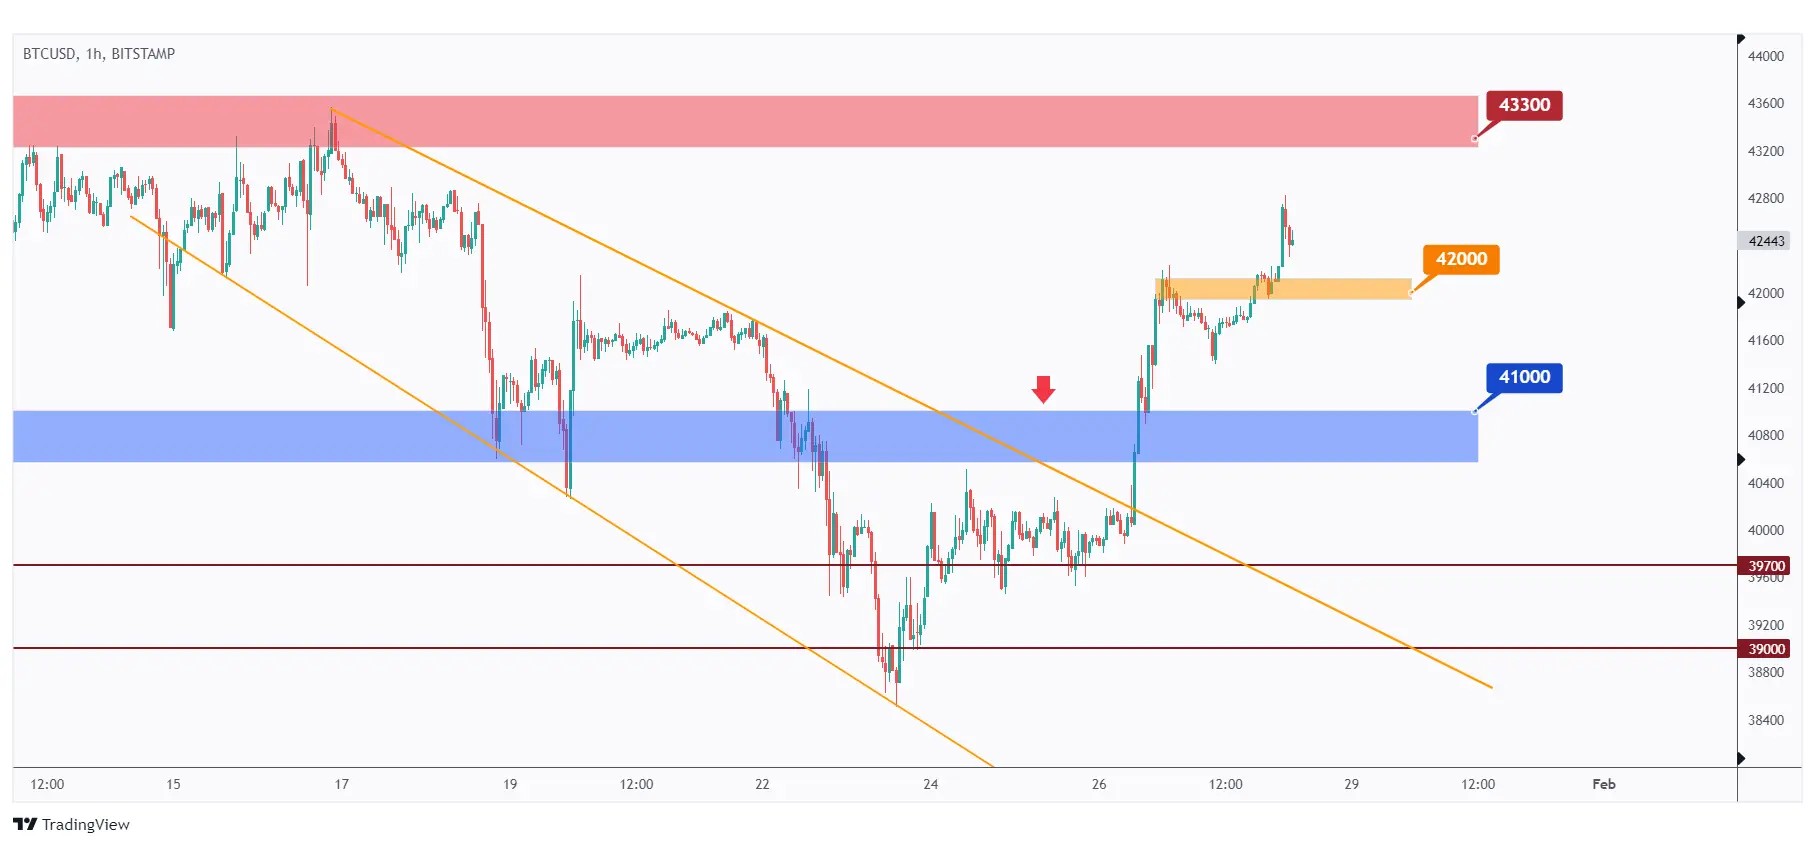
In the 1-hour timeframe, after surpassing the $41,000 level mentioned last week, BTC traded higher and is currently approaching a previous major high at $43,300.
The bulls will continue to be in control unless the last minor low marked in orange at $42,000 is broken downward. In such a scenario, a movement towards the $41,000 support again would be anticipated.
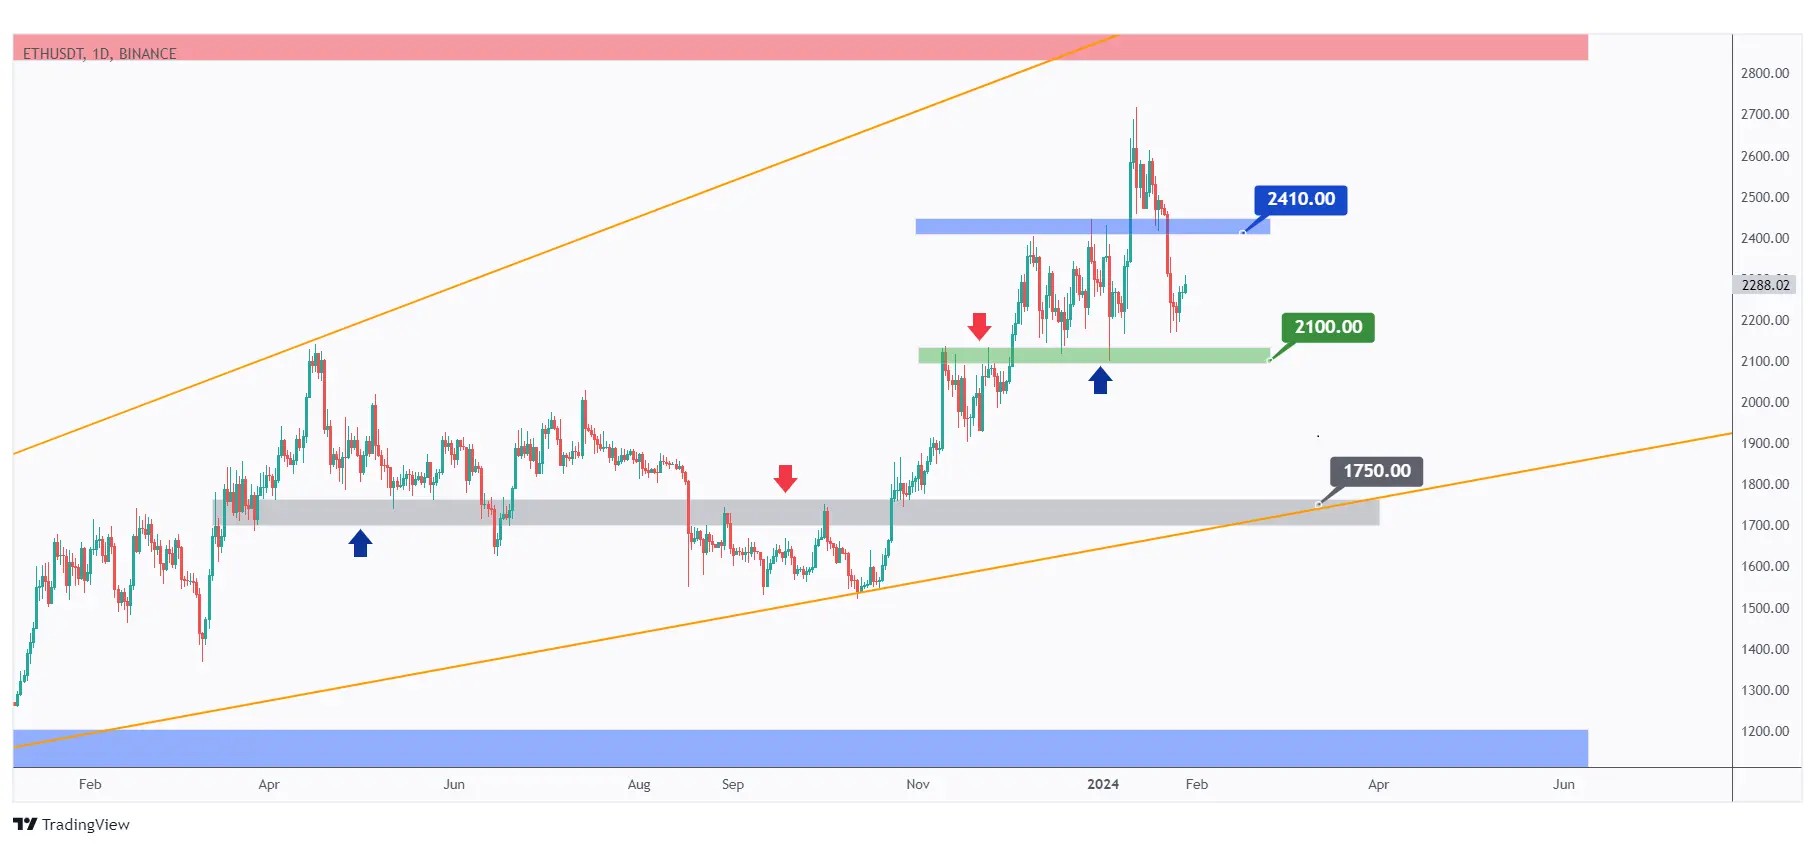
ETH broke below the $2410 previous major low and traded lower.
Currently, ETH is approaching a local support at $2100. As long as this support holds, we will actively look for buy setups on lower timeframes.
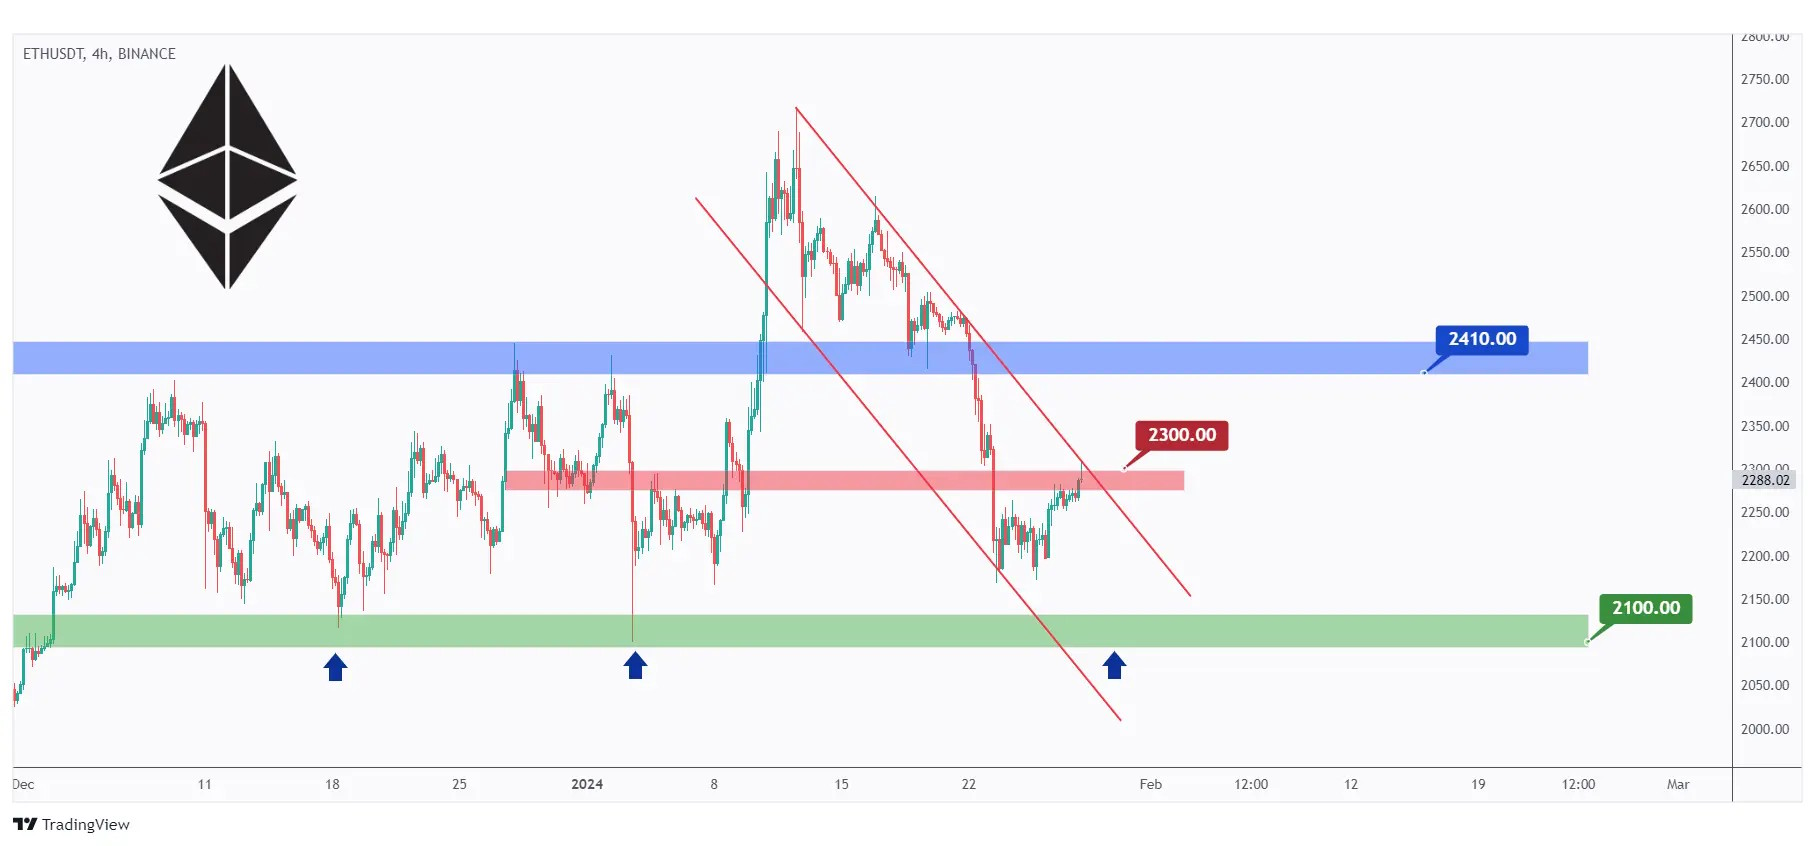
In the 4-hour timeframe, ETH has been overall bearish, trading within the falling channel in red.
For the bulls to take charge and shift the momentum from bearish to bullish, a breakout above the upper red trendline and the previous major high at $2300 is necessary. In this scenario, a movement towards the $2410 supply zone would be expected.
Meanwhile, ETH would persist in its bearish trend, and a movement towards the $2100 support is anticipated.
Quotes / Advices
Here is how you can treat trading like a sport:
Regularly update skills, stay informed on market trends, and practice risk management.
Manage emotions like a seasoned athlete; avoid impulsive decisions and stick to the game plan.
Prioritize physical and mental well-being; a healthy trader performs better.
Be agile, adjust strategies based on changing market conditions for long-term success.
Closing Remarks
In summary, the crypto market witnessed a mixed performance as Bitcoin (BTC) rejected the $40,000 support zone, causing a 1.6% rise with various altcoins following suit.
Despite some altcoins sustaining a bearish trend over the past 7 days, a bullish movement occurred towards the end of the week.
The US500 index continued its bullish trend, reaching new all-time highs but approaching a potential resistance.
The DXY exhibited a bullish shift, heading towards a supply zone at $104.
Gold traded within a range, and its movement towards $2000 support or $2100 resistance depended on the breakout direction.
USDT.D, a key indicator of trader sentiment, declined towards the 5.83% support, potentially impacting the overall crypto market.
BTC rejected the $39,000 support, aiming for the $50,000 resistance with key levels to watch.
ETH faced a bearish trend, with potential shifts based on breakouts above or below key levels.