
elcome to another crypto market outlook for the 24th of January!
In today's market analysis, we will explore the current state of the crypto market. BTC is hovering around a support level at the $40,000 mark, while USDT.D is attempting to break through a resistance zone.
Moreover, we will cover five altcoins (OCEAN, SOL, CELR, DYDX, and ADA), emphasizing their key levels and potential trading setups.
Are you ready?
Today, we will cover the following topics:
- USDT.D and BTC Analysis
- 5 Altcoins Analysis
- Quotes / Advices
- Closing Remarks
USDT.D and BTC analysis
As usual, I always start my analysis with USDT.D as it serves as an indicator of traders' sentiment. USDT.D reflects whether traders are optimistic (investing in cryptocurrencies) or pessimistic (shifting towards stablecoins).
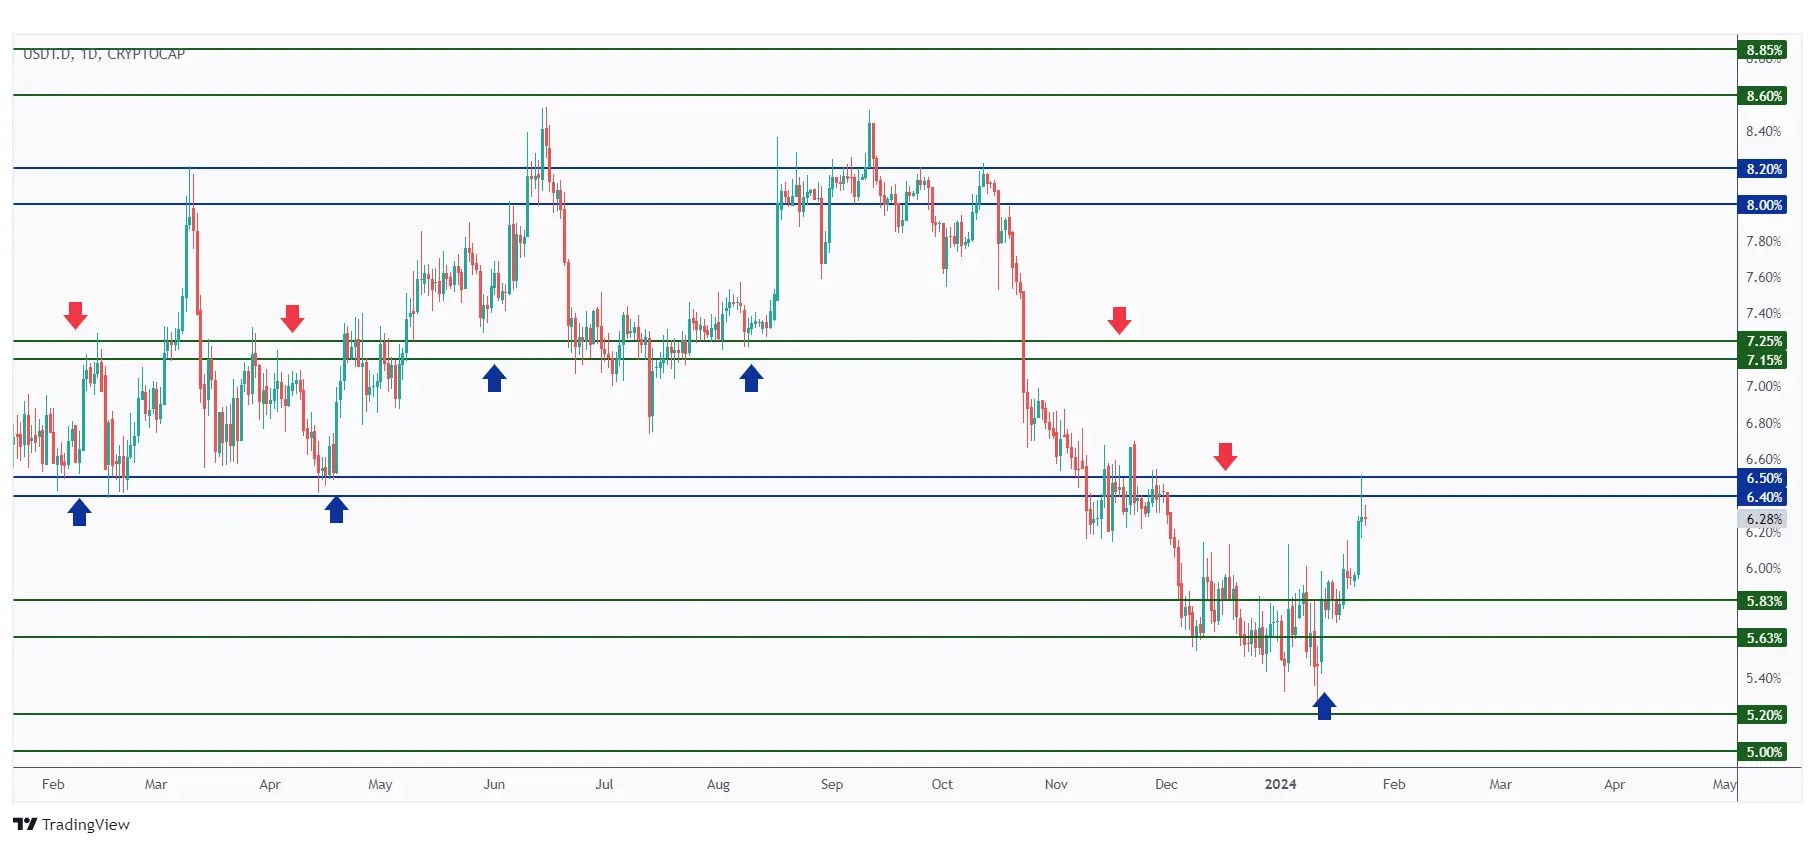
After breaking above the 5.83% resistance, USDT.D traded higher and is currently facing rejection at the 6.5% resistance.
As long as this new resistance holds, we anticipate a bearish movement, which could positively impact the overall sentiment in the crypto market.
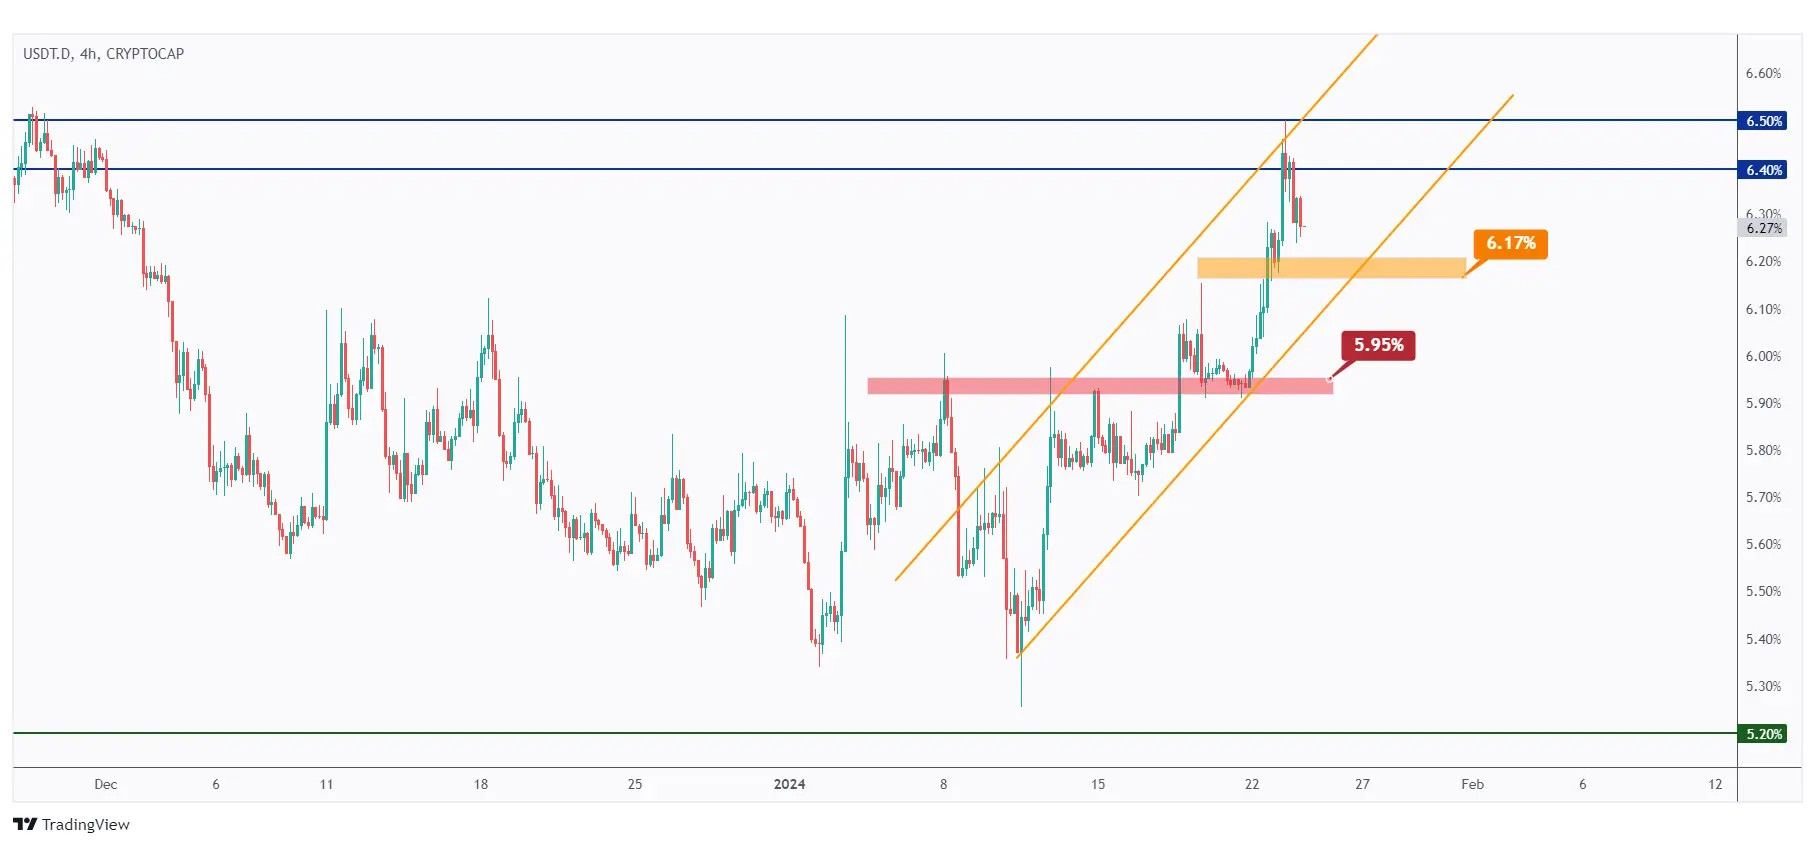
In the 4-hour timeframe, USDT.D has been bullish trading within the rising channel in orange.
For the bears to assume control, a break below the lower orange trendline and the last major low at 6.17% is needed.
Meanwhile, USDT.D would maintain its bullish trend, and if there is an upward breakout above the 6.5% resistance, we anticipate further bullish movement from a medium-term perspective.
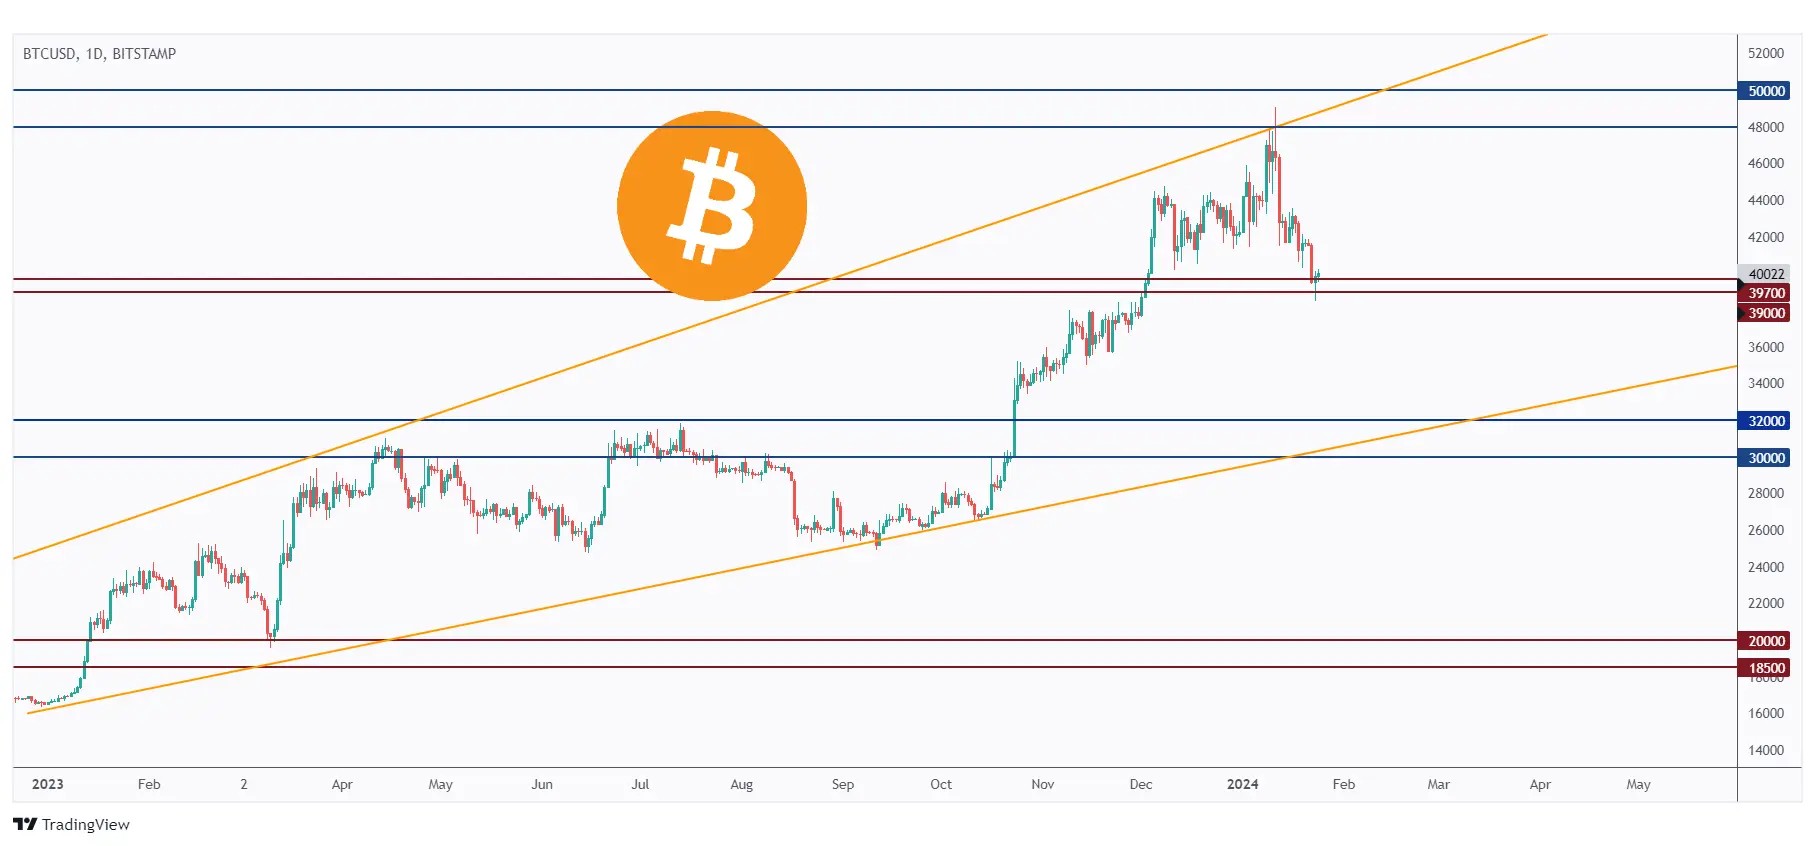
BTC is currently hovering around a strong support zone at $39,000. If this support is breached downward, we anticipate further bearish movement towards the $37,000 demand zone.
Meanwhile, the bulls still have an opportunity to step in.
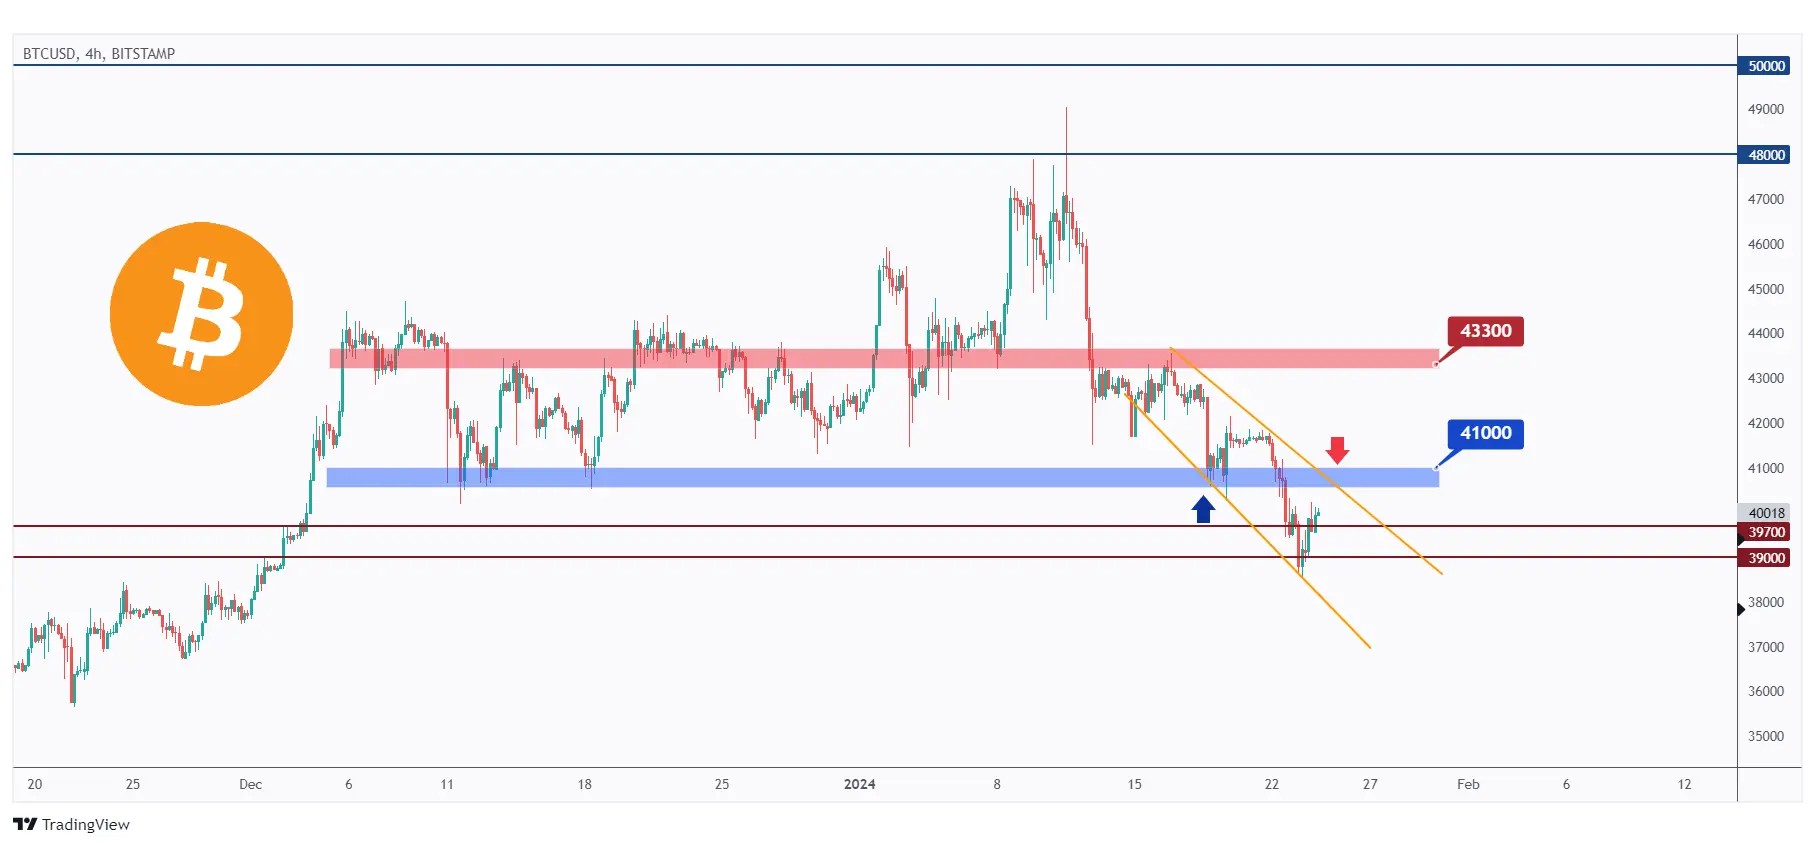
For the bulls to assume control and initiate the next bullish impulse, a momentum candle close above the local resistance marked in blue at $41,000 is required.
In this scenario, a movement towards the next resistance at $43,300 would be expected.
5 Altcoins Analysis
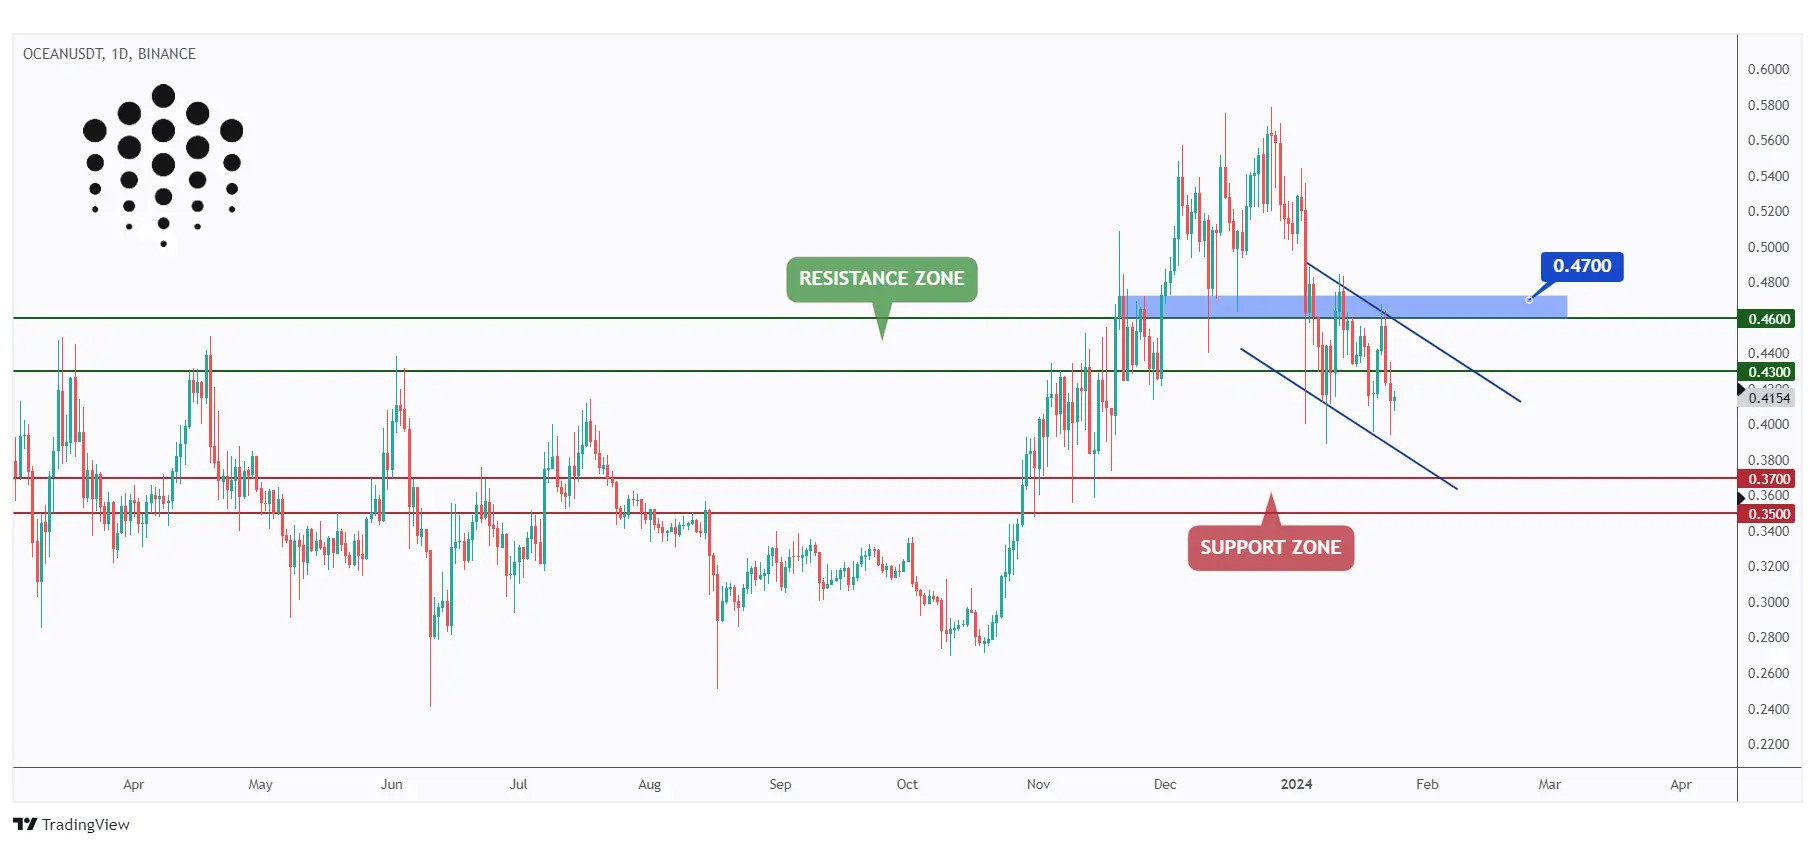
Following a decline below $0.43, OCEAN has been in a bearish trend, trading within the descending blue channel.
To regain control, the bulls need to break above the $0.47 previous major high marked in blue.
In the meantime, OCEAN may continue to trade lower and test the $0.37 support, where we will be actively seeking new short-term buy setups.
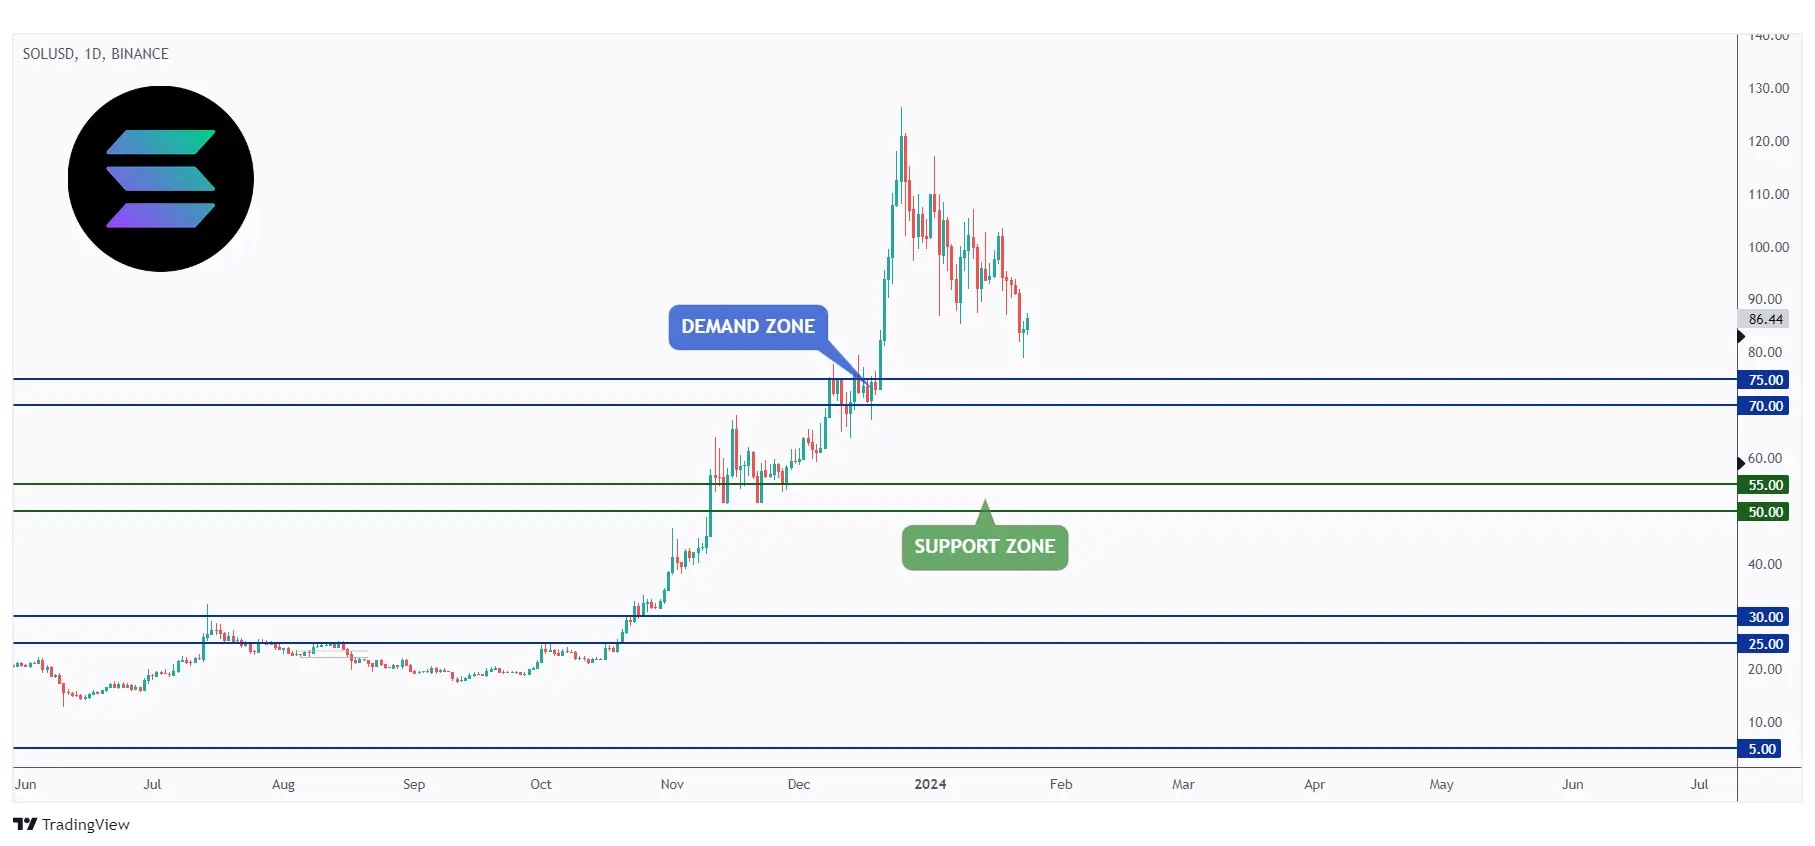
Turning our focus to SOL, this specific altcoin is currently in a correction phase and retesting a strong demand zone at $75.
Thus, we will be looking for trend-following buy setups on lower timeframes.
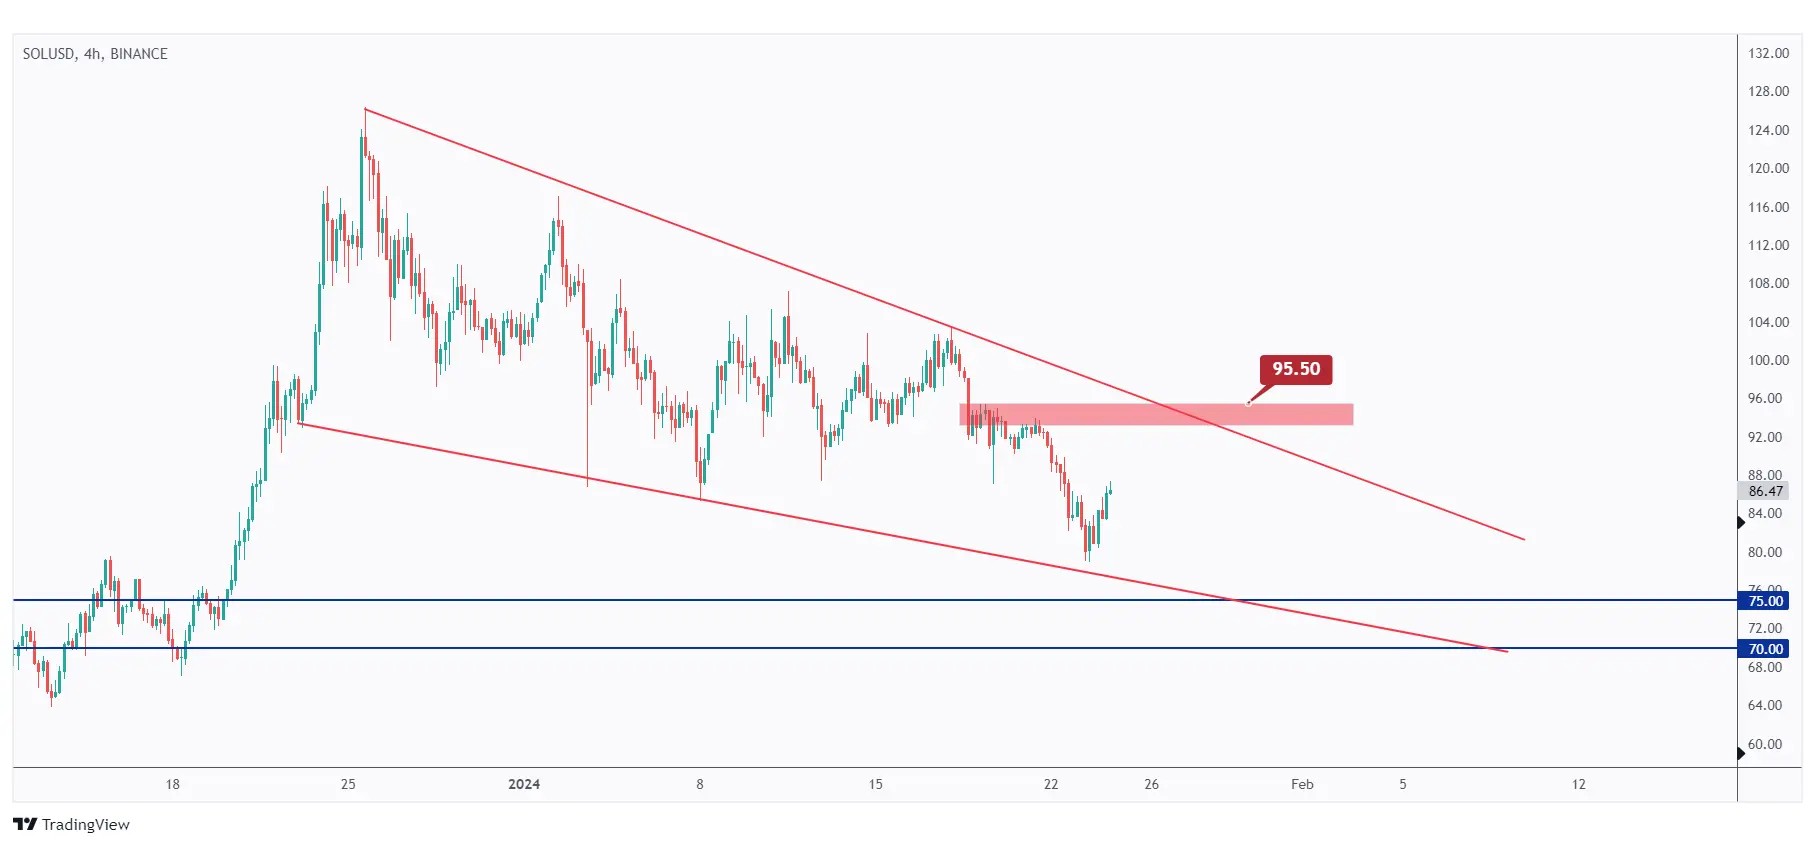
In the 4-hour timeframe, SOL has been trading within the falling wedge pattern marked in red.
For the bulls to establish control, a momentum candle close above the last major high marked in red at $95.5 is needed.
Meanwhile, SOL would be bearish and can still test the $75 demand zone where we will be looking for short-term buy setups.
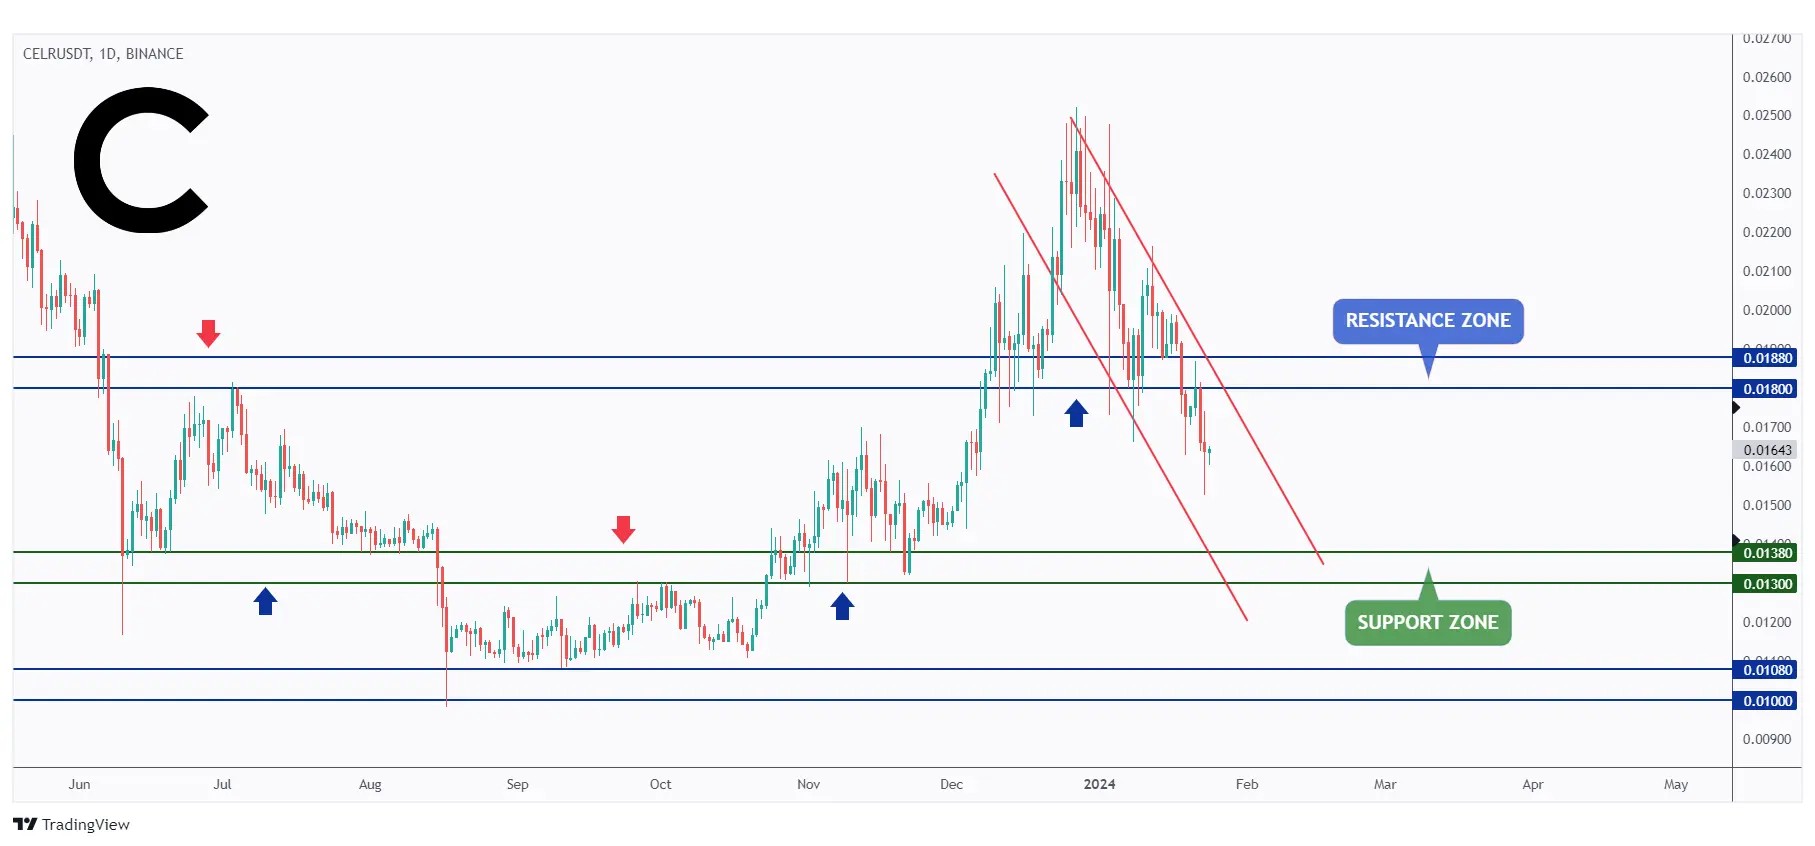
Next on the list for today, we have CELR. It has been overall bearish trading within the falling channel in red.
As CELR approaches the $0.0138 support zone, we will be actively searching for potential buy setups on lower timeframes.
In parallel, for the bulls to assume control from a long-term perspective, a momentum candle close above the resistance at $0.0188 is needed.
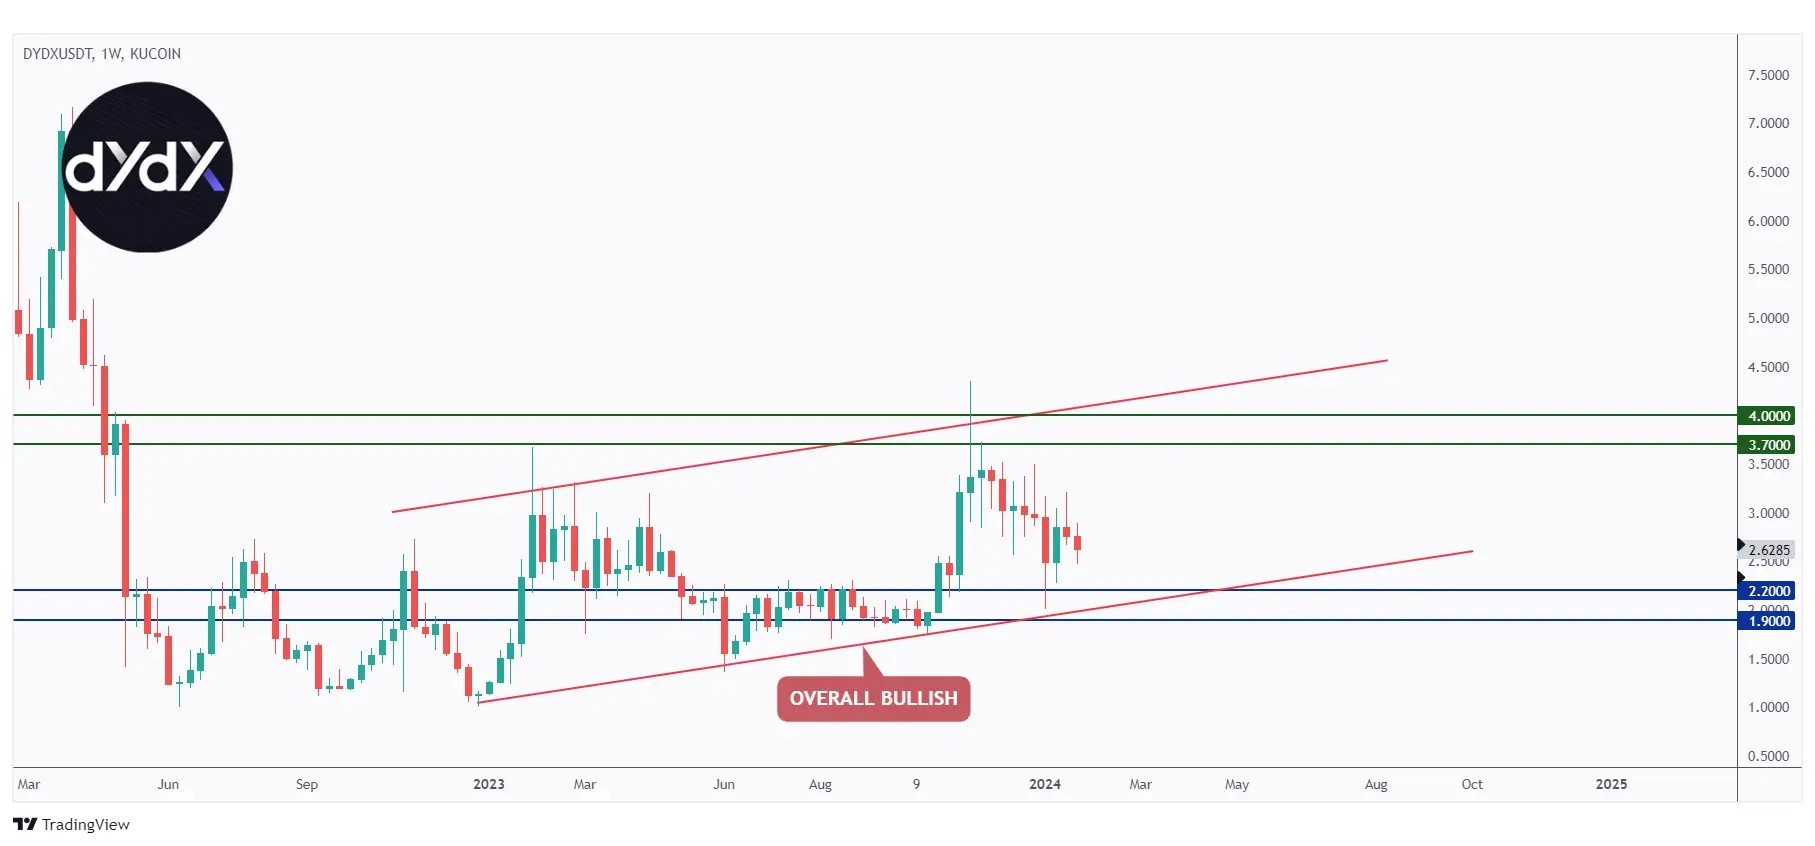
Analyzing DYDX, it has generally shown a bullish trend from a long-term perspective, trading within the rising channel in red.
Currently, DYDX is undergoing a correction phase and approaching a strong support zone highlighted in blue.
Therefore, as long as the support holds, we will actively search for trend-following buy setups on lower timeframes.
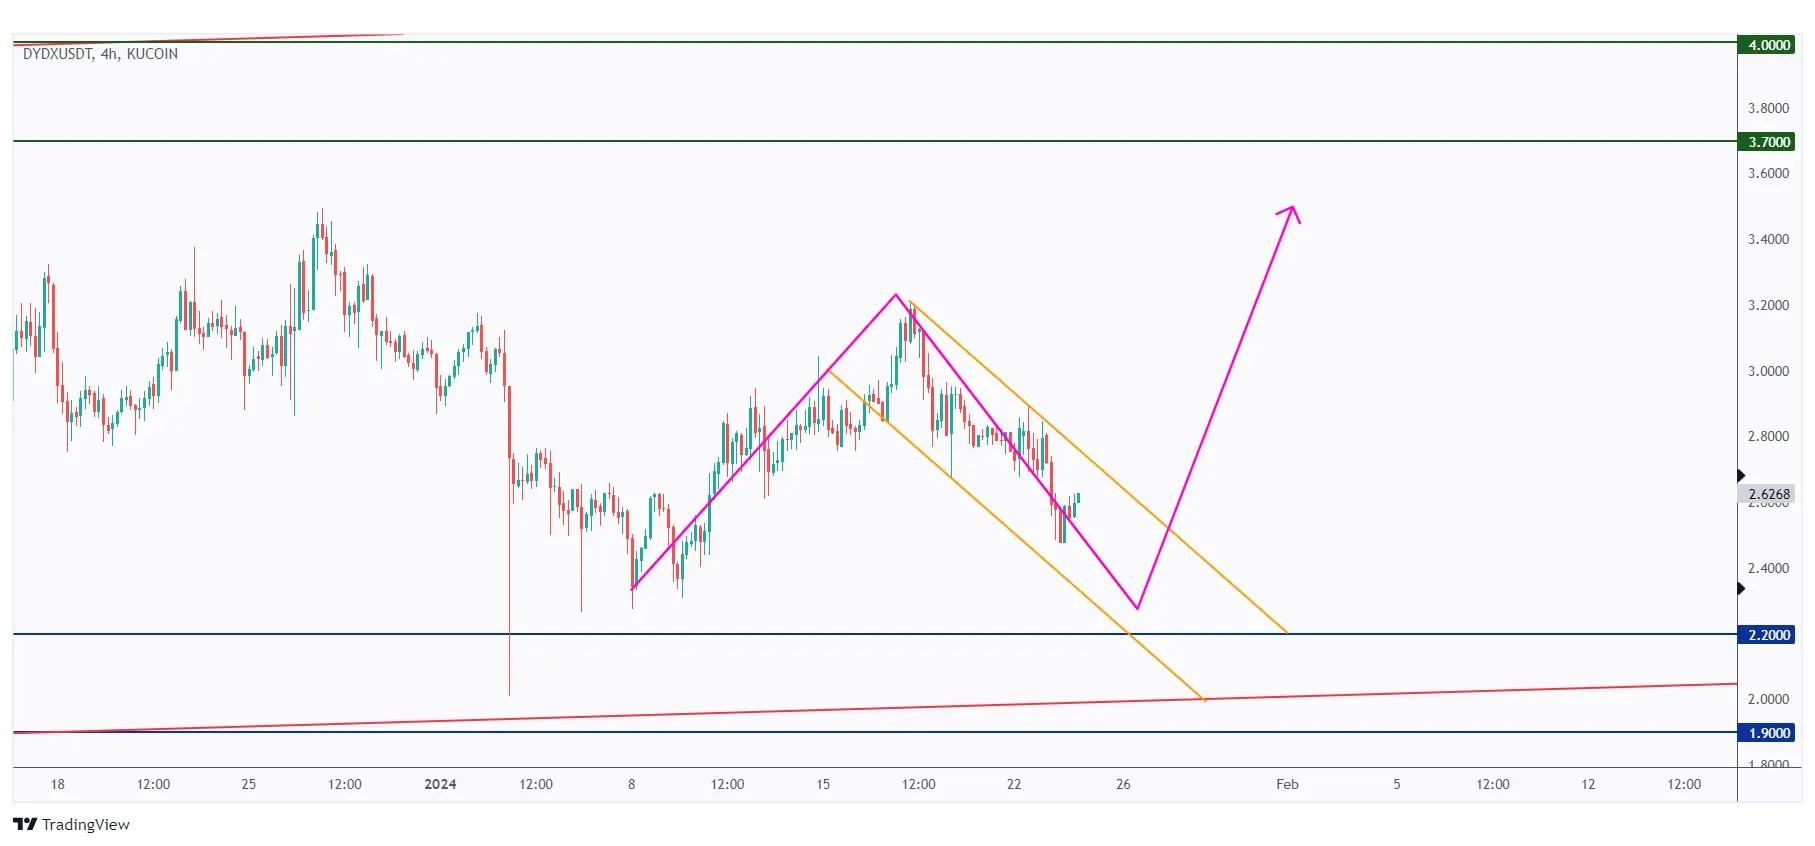
Examining the 4-hour timeframe, it's apparent that DYDX is currently bearish from short-term perspective trading within the falling orange channel.
For the bulls to assume control and initiate the next upward impulse movement, a breakout above the upper orange trendline is needed.
Meanwhile, DYDX could remain bearish and potentially continue trading lower to test the daily support zone.
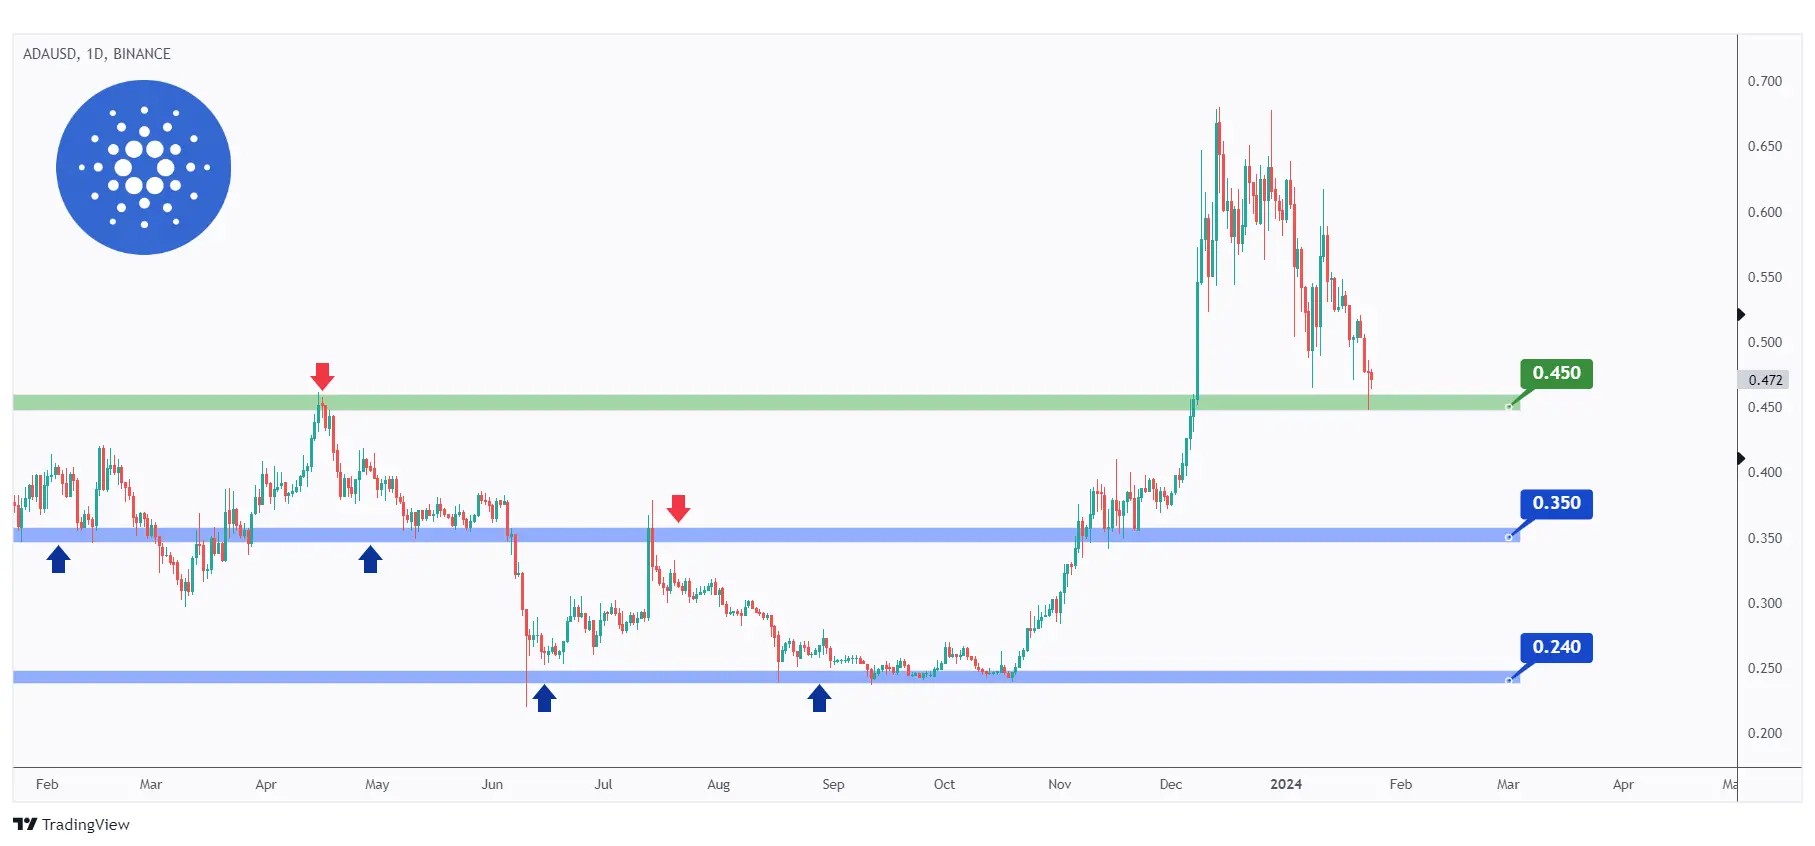
After rejecting the $0.68 weekly supply, ADA has been overall bearish. However, it is currently retesting a previous major high at $0.45 so we will be looking for buy setups on lower timeframes as long as the support holds.
If the $0.45 is broken downward, we anticipate further bearish movement towards the $0.35 demand zone.
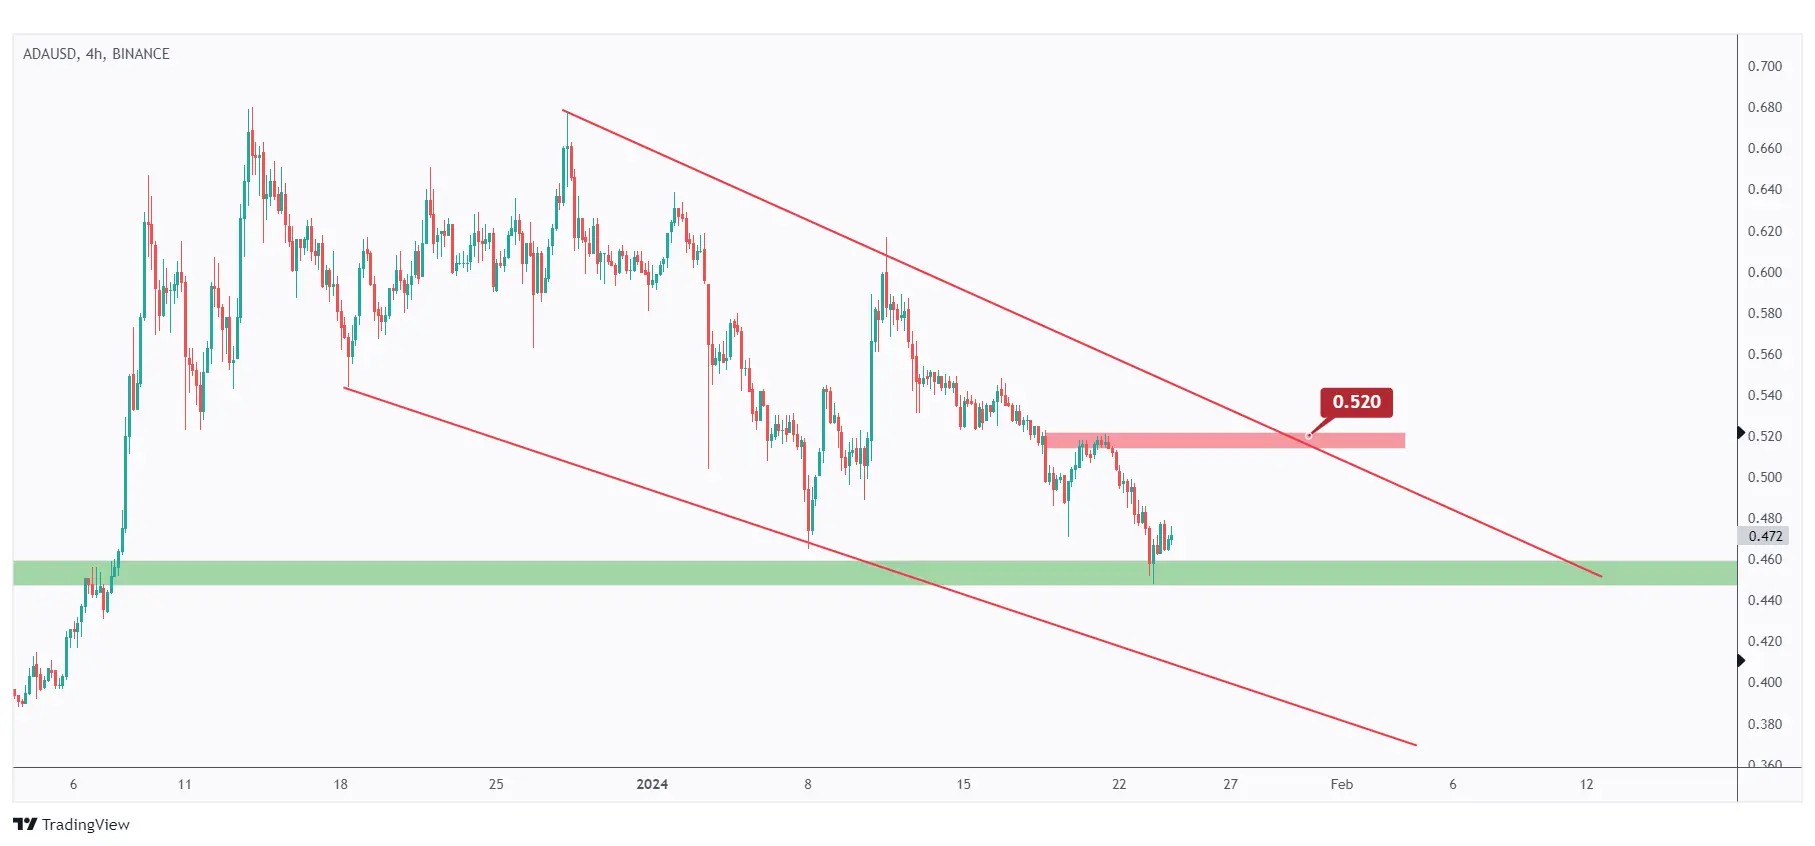
For the bulls to assume control once more and initiate the next upward impulse movement, a momentum candle close above the upper red trendline and previous major high at $0.52 is needed.
Quotes / Advices
Here are 5 tips regarding diversification in crypto:
Diversify your portfolio by investing in different types of categories.
Diversify across companies of different sizes and market capitalizations.
Aim for a balance between high-risk, high-reward assets and more stable, conservative investments.
Regularly review and rebalance your portfolio.
Understand the correlation between assets in your portfolio.
Closing Remarks
In summary, the outlook begins with an assessment of USDT.D, serving as a sentiment indicator for traders. After breaking a resistance level, USDT.D faces rejection at 6.5%, suggesting potential bearish movement.
BTC hovers around $39,000 support, with a potential bearish move if breached. Bulls can gain control with a close above $41,000, targeting $43,300.
Five altcoins are then analyzed:
OCEAN is in a bearish trend below $0.43, requiring a break above $0.47 for a bullish reversal.
SOL corrects at $75, and a close above $95.5 is needed for bullish control.
CELR is bearish, approaching the $0.0138 support.
DYDX shows a long-term bullish trend but undergoes a correction, seeking buy setups near support.
ADA is overall bearish but retesting $0.45; a break above $0.52 is crucial for bullish momentum.