
elcome to another crypto market outlook for the 21st of January!
In this edition, we'll delve into major assets such as US500, DXY, Gold, Bitcoin, and Ethereum, highlighting critical levels and potential trade setups.
From Bitcoin consolidating within a range around support to ETH undergoing a correction phase, and the Fear & Greed Index consistently signaling "Greed”, this outlook covers it all.
Are you ready?
Today, we will cover the following topics:
- Market Heatmap and Fear and Greed Index
- US500, DXY and Gold Analysis
- USDT.D, Bitcoin and Ethereum Analysis
- Quotes / Advices
- Closing Remarks
Market Heatmap and Fear and Greed Index
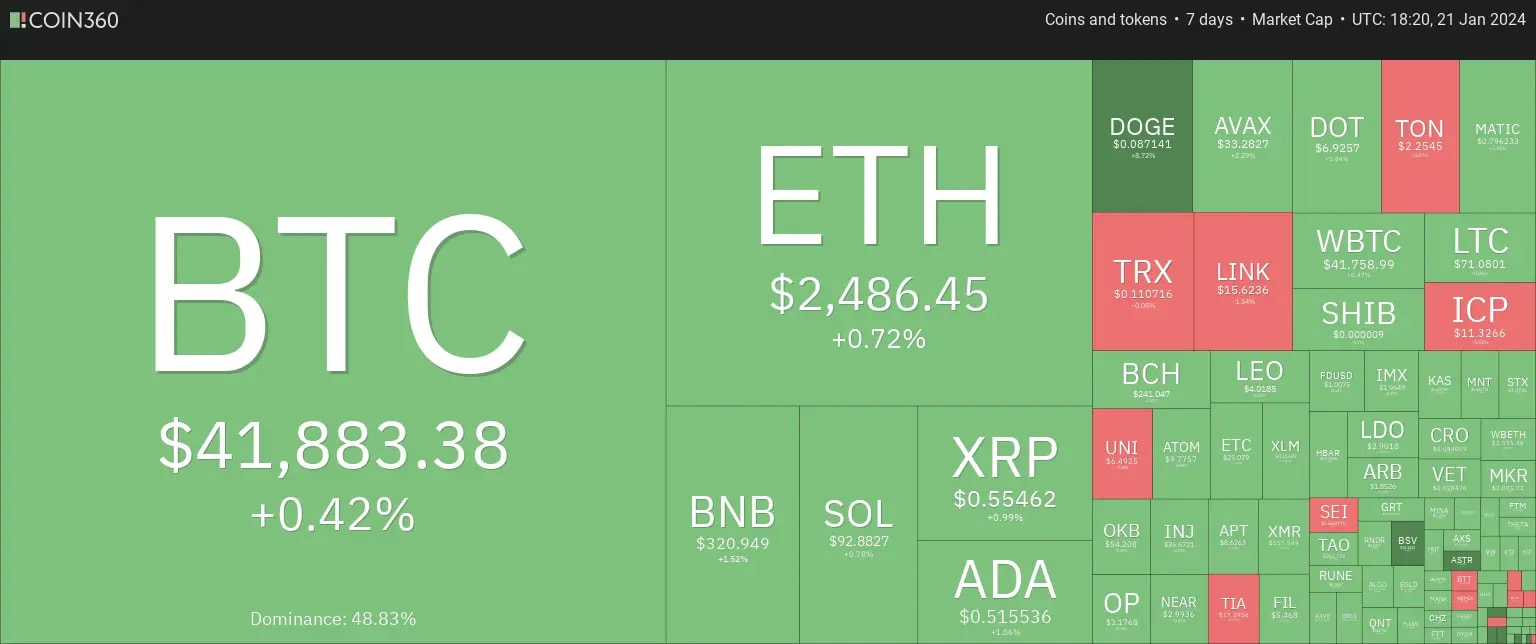
To initiate my research, I delved into the analysis by examining the market heatmap, which provided a comprehensive overview of the entire cryptocurrency market.
After experiencing two bearish weeks, BTC has been consolidating within a narrow range around $42,000. The past week has been relatively uneventful, with BTC showing a modest increase of only 0.42%.
On the heatmap, it is clear that most altcoins have been bullish. However, the bullish momentum is considered small, with ETH, for example, showing a slight increase of +0.72%.
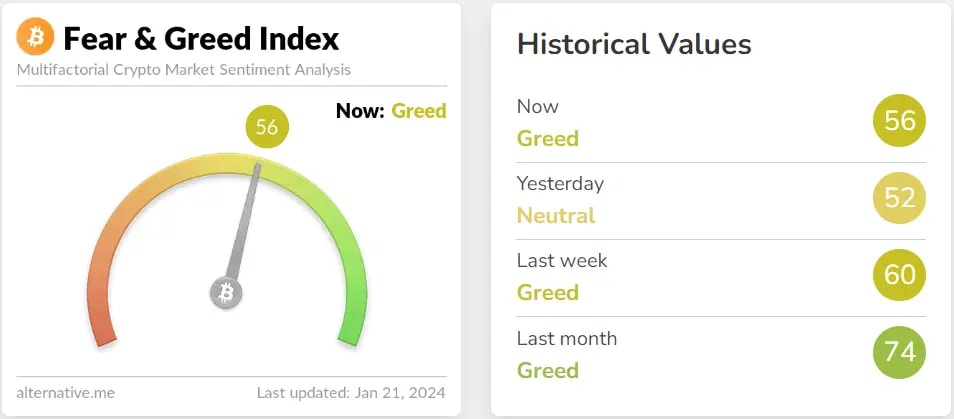
The Fear & Greed Index has consistently shown 'Greed' for almost two months, despite recent bearish movements in the crypto space. This suggests that traders remain optimistic, particularly with Bitcoin's Halving approaching in the coming months.
US500, DXY and Gold analysis
We consistently monitor the US500 index to assess the current market sentiment. This practice is crucial because the cryptocurrency market often exhibits a significant correlation with the stock market, and this interconnection can impact its fluctuations.
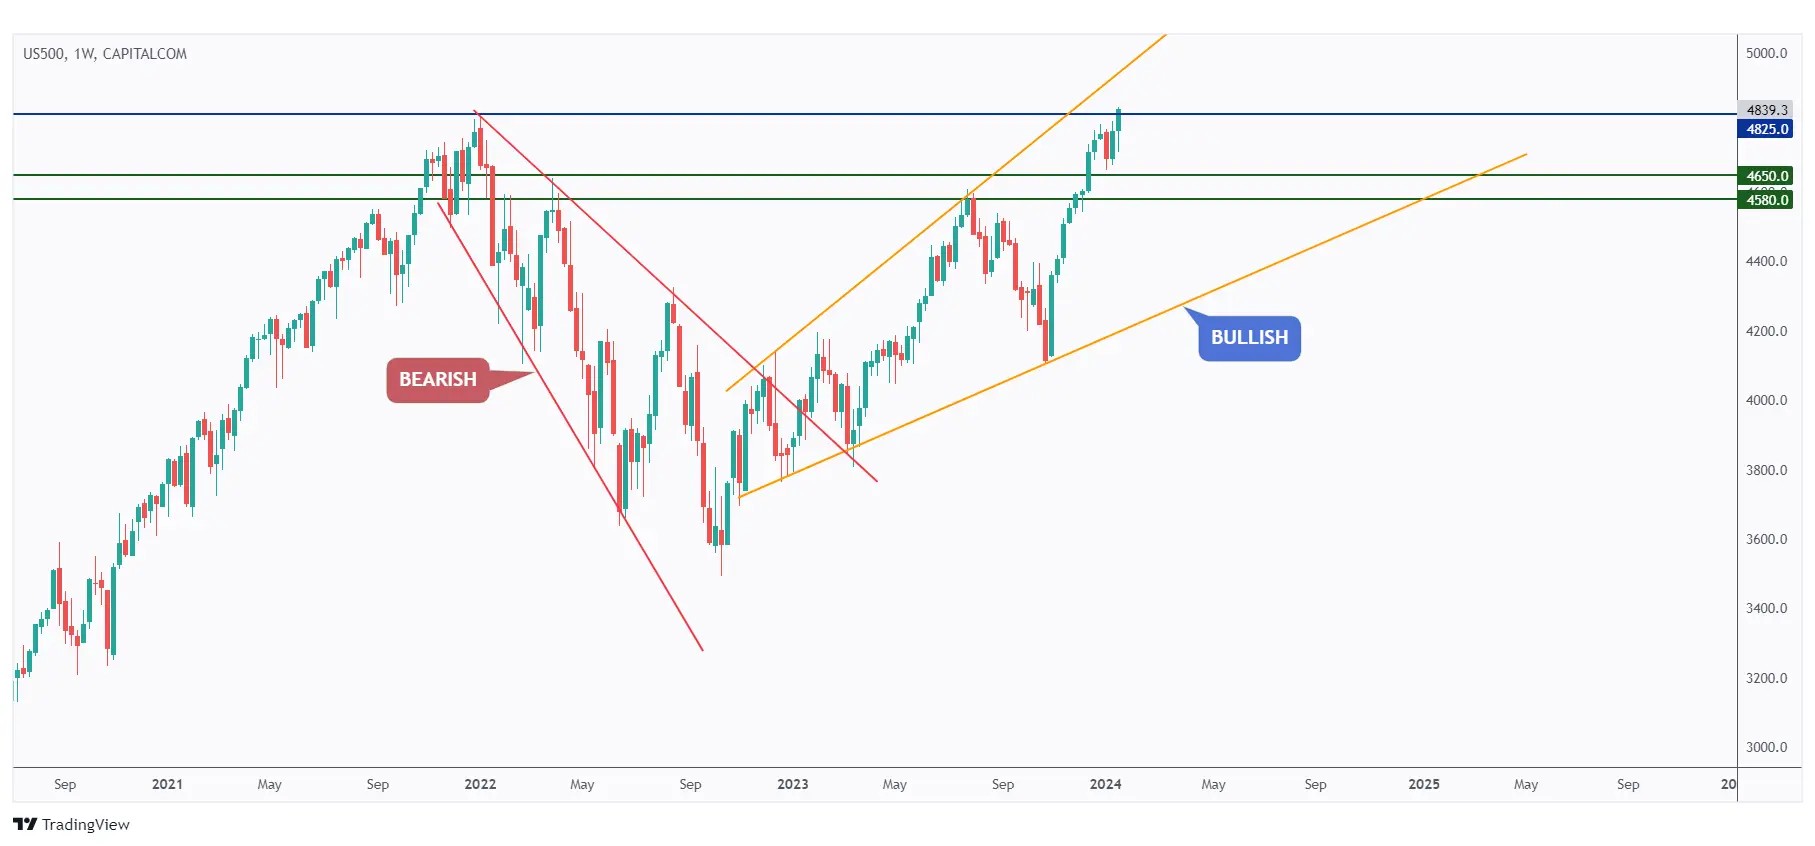
This week, the US500 remains overall bullish, and there is an ongoing attempt to break above the all-time high at $4825. To establish control from a long-term perspective, a crucial requirement is a breakout above the $4825 level.
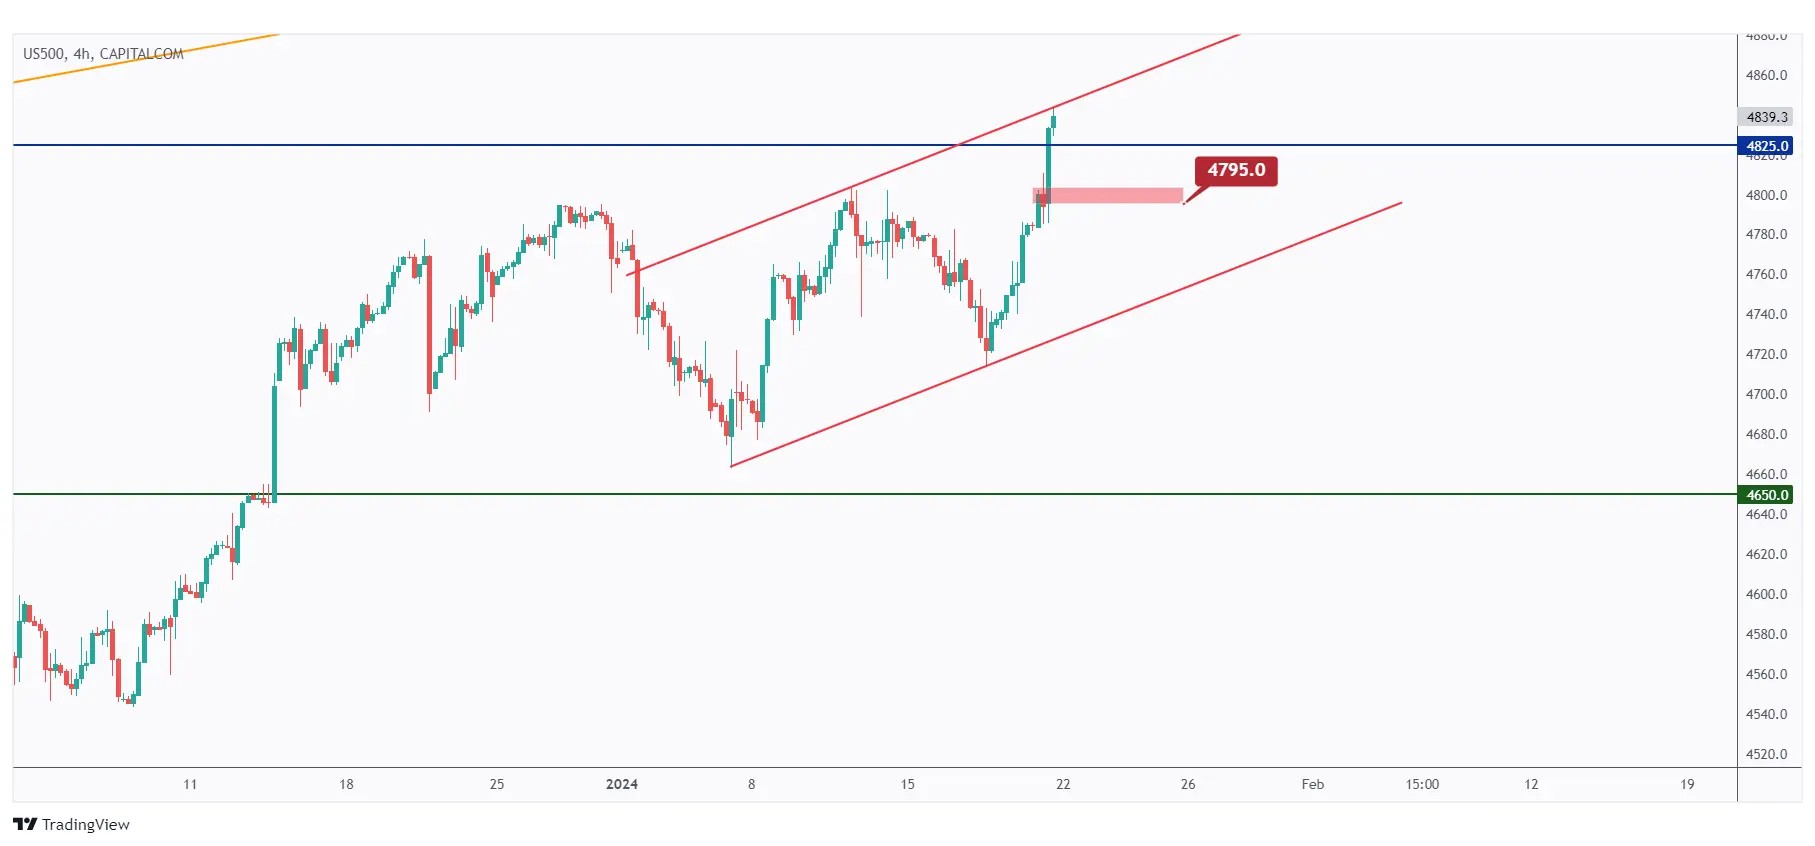
In the 4-hour timeframe, the bullish trend is evident as US500 has been trading within the rising channel outlined in red. However, it is currently hovering around the upper boundary of the channel.
The expectation is for the bulls to sustain control, unless there is a downward break below the last low at $4795.
We consistently monitor the DXY - USD Index as part of our routine analysis. This is crucial because the value of nearly all assets, including BTC/USD, is closely tied to the USD, which serves as the benchmark currency in the financial market.
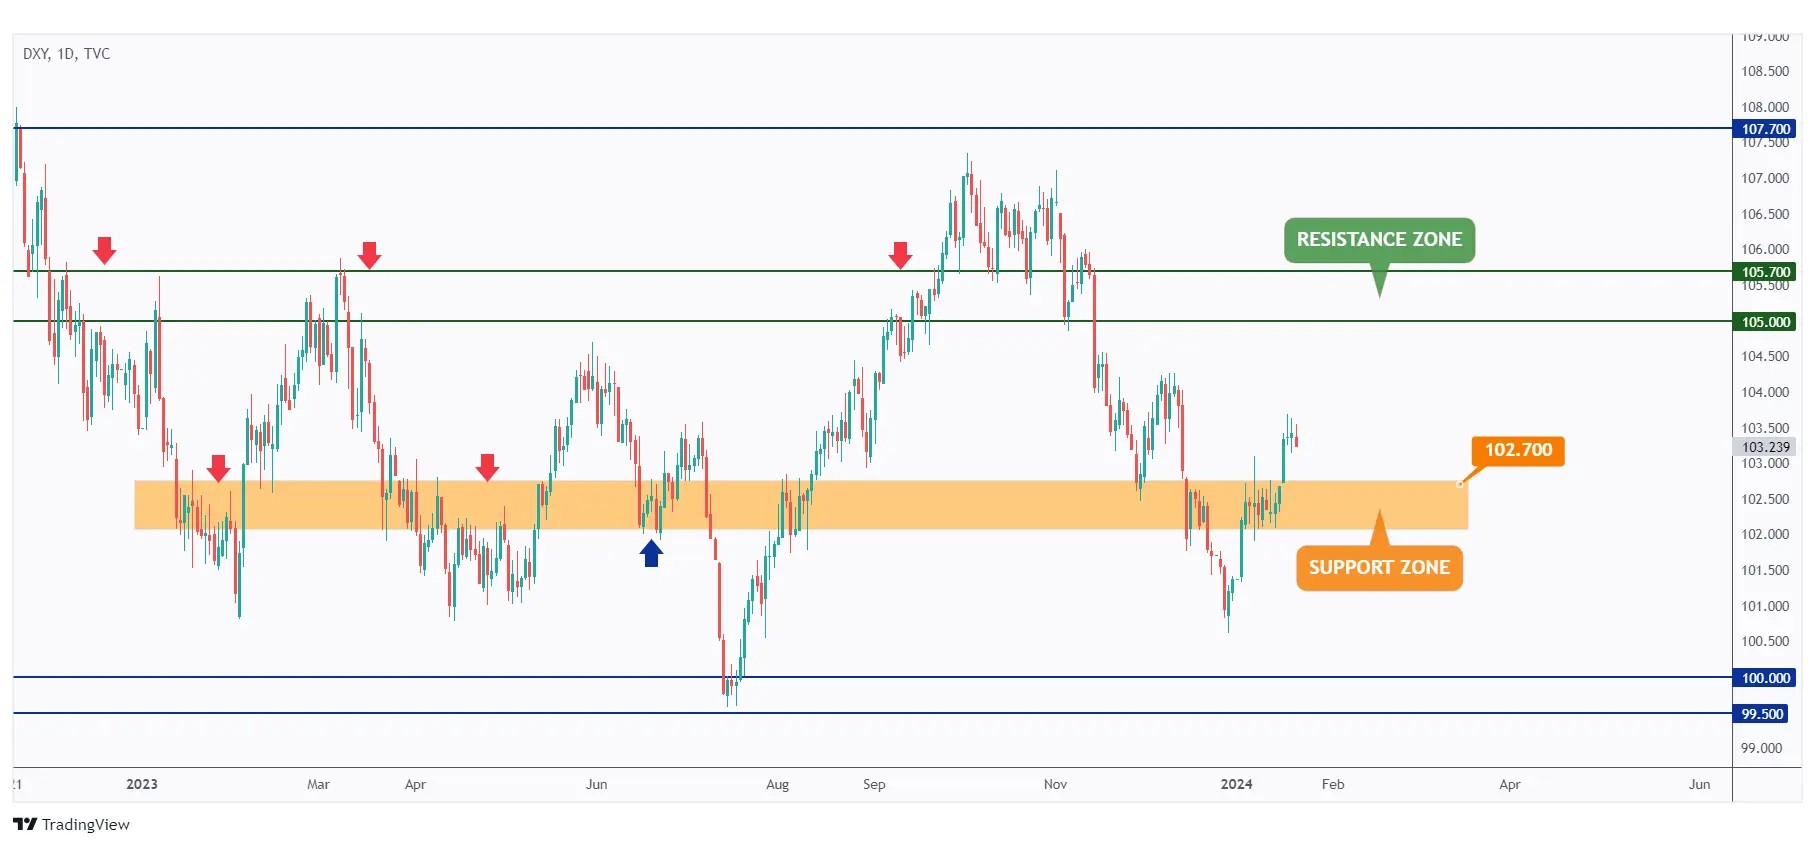
In line with our previous analysis last week, DXY broke above the $102.7 resistance and continued to trade higher.
Hence, the $102.7 level is now acting as support, and we anticipate further bullish movement towards the next resistance at $105.
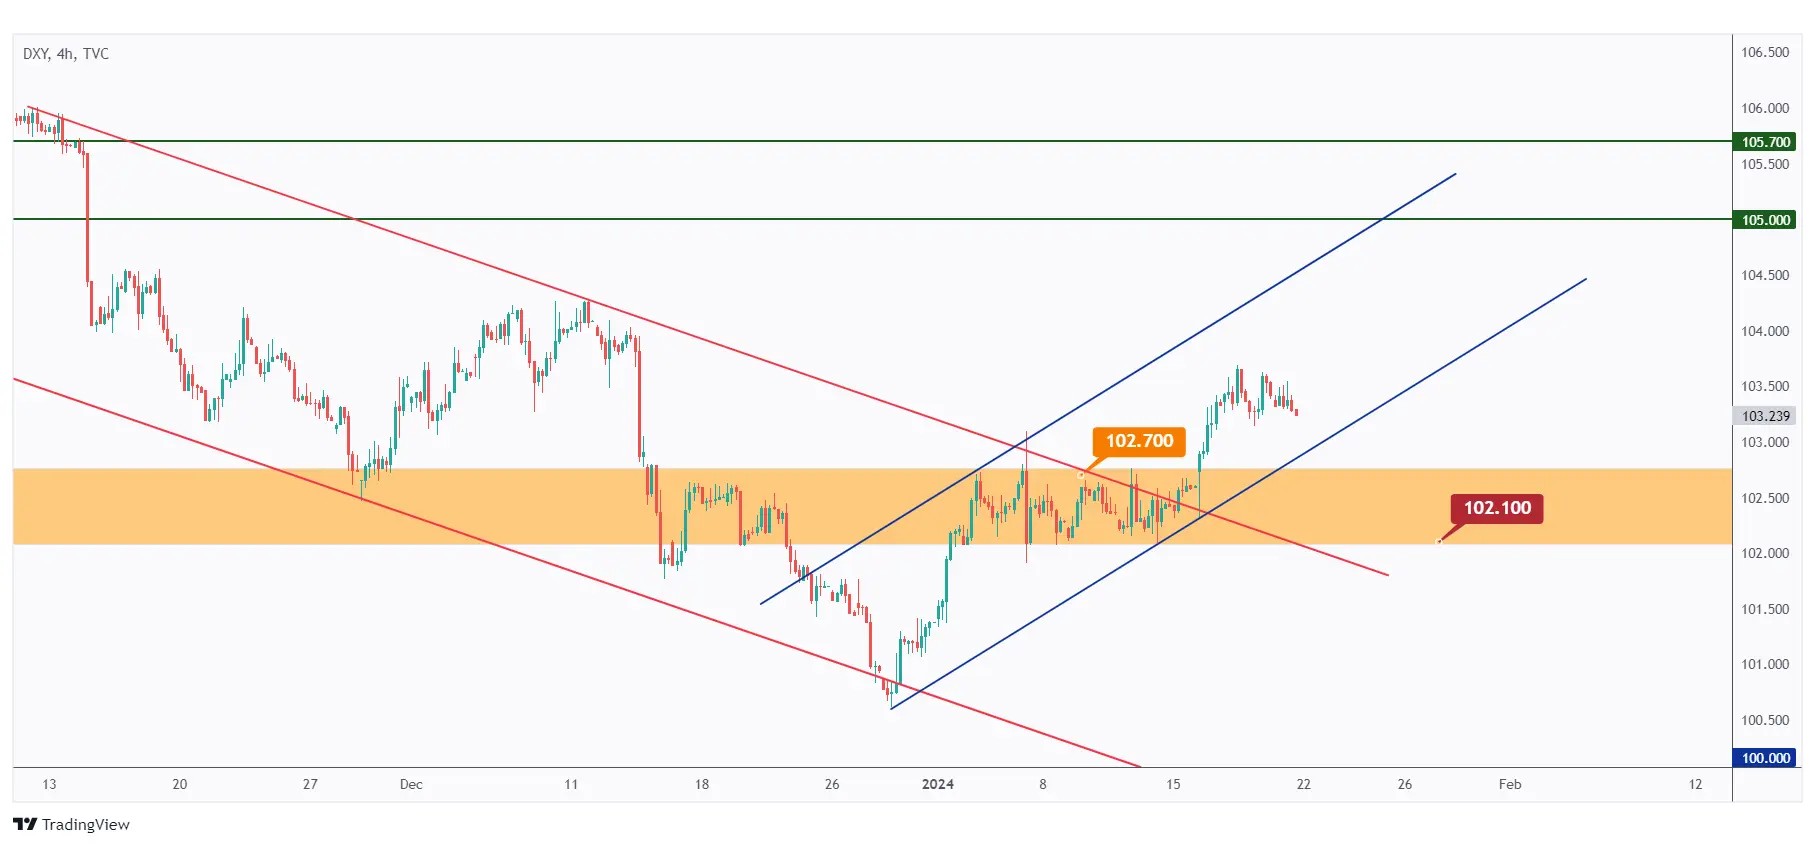
In the 4-hour timeframe, there was a notable shift in momentum from bearish to bullish this week for DXY.
DXY is set to stay bullish in the medium term as long as it stays within the rising blue channel. To shift back to a bearish momentum, it needs to break below the $102.1 support.
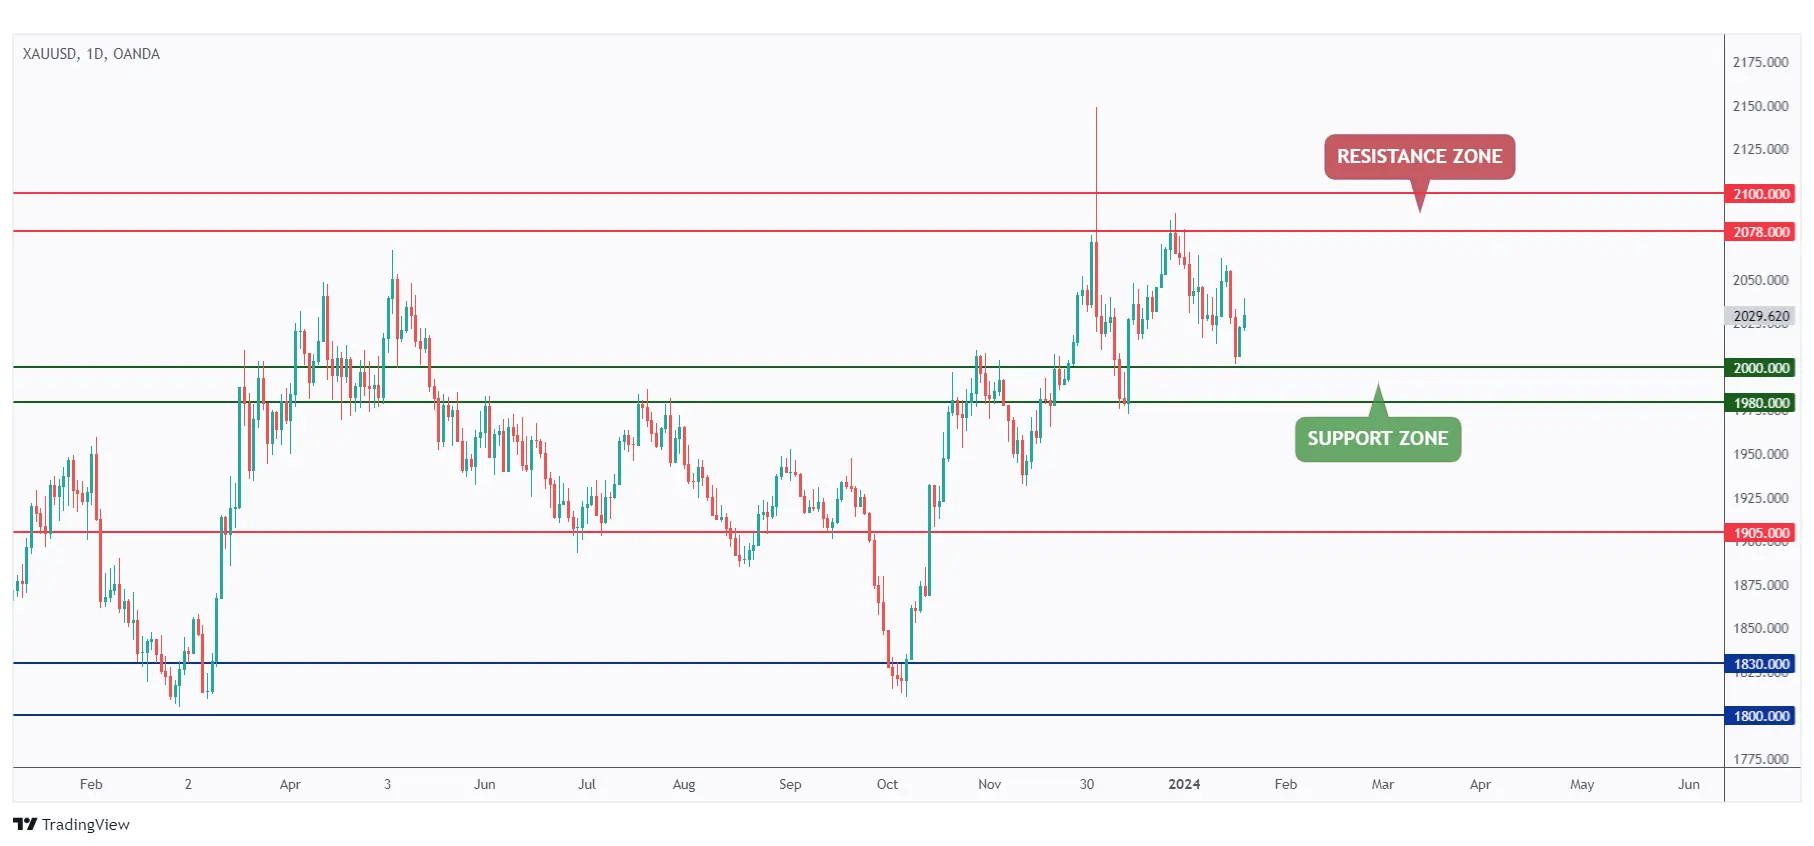
Gold has been fluctuating within a range between our highlighted support and resistance levels. This week, Gold rejected our $2000 support and the round number, and traded higher.
As long as the support holds, we anticipate a bullish continuation towards the $2078 resistance zone.
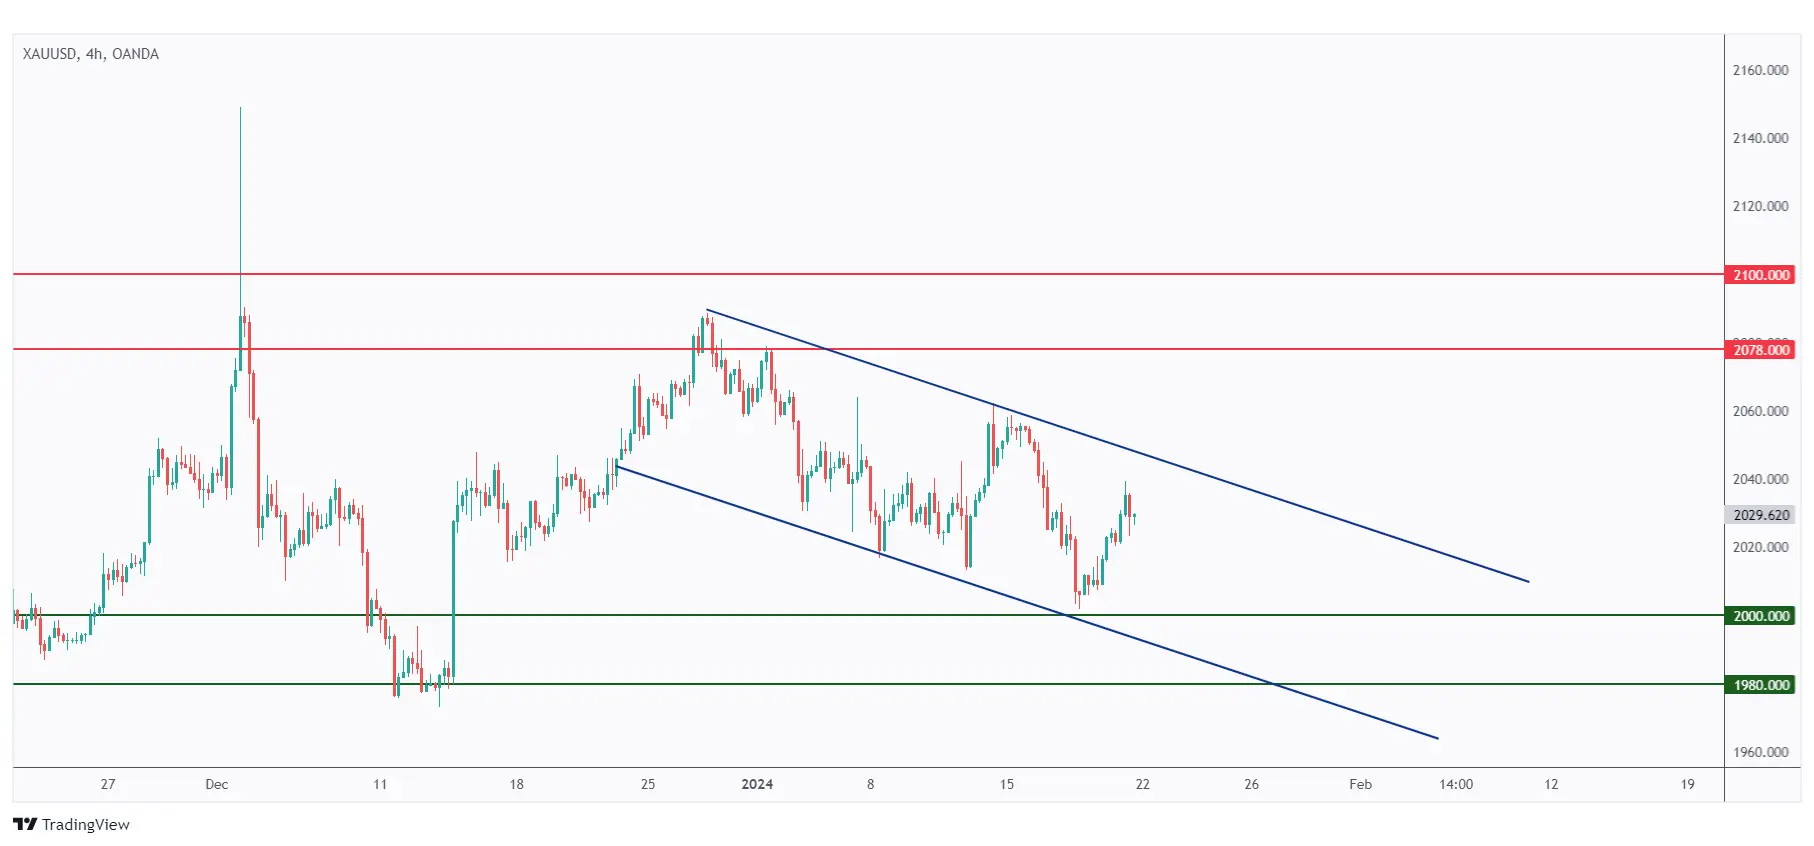
In the 4-hour timeframe, for the bulls to take full control, a breakout above the falling channel marked in blue is required.
Meanwhile, as Gold approaches the lower bound of the channel and the $2000 support, we will be actively seeking new short-term buy setups.
USDT.D, Bitcoin and Ethereum analysis
As a standard practice, I commence my analysis with USDT.D as it serves as a crucial indicator of traders' sentiment. USDT.D offers valuable insights into whether traders are optimistic, signaling increased investment in cryptocurrencies, or pessimistic, indicating a shift towards stablecoins.
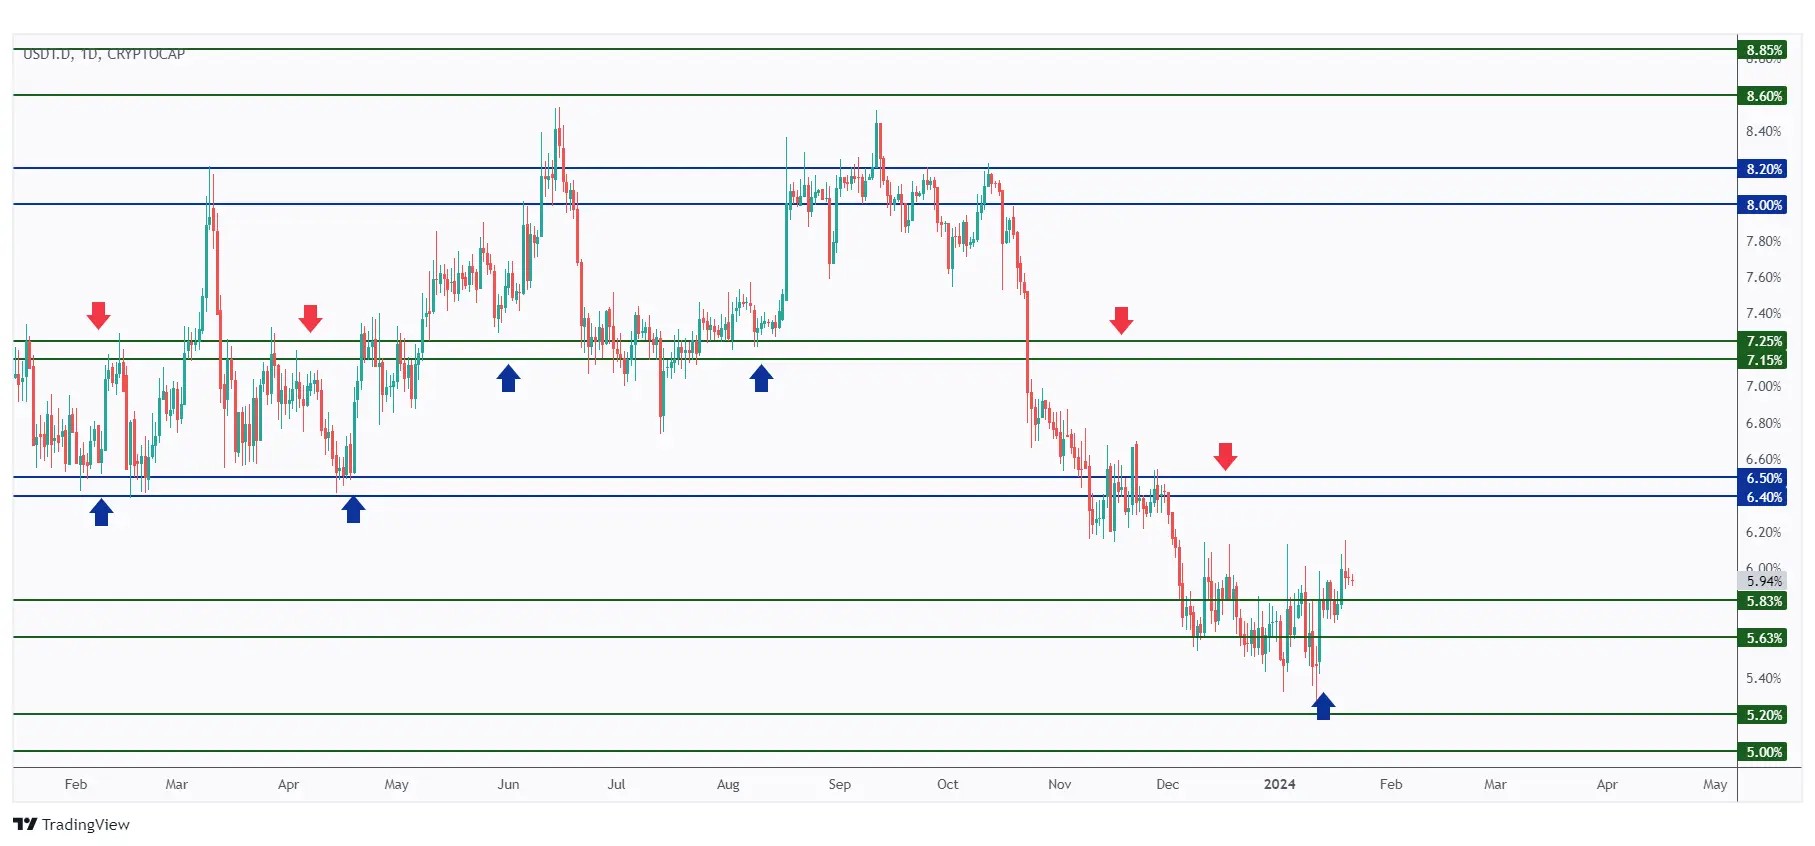
USDT.D has broken above the resistance zone and is currently retesting it.
As long as the 5.63% support holds, we anticipate a bullish continuation towards the next resistance at 6.4%.
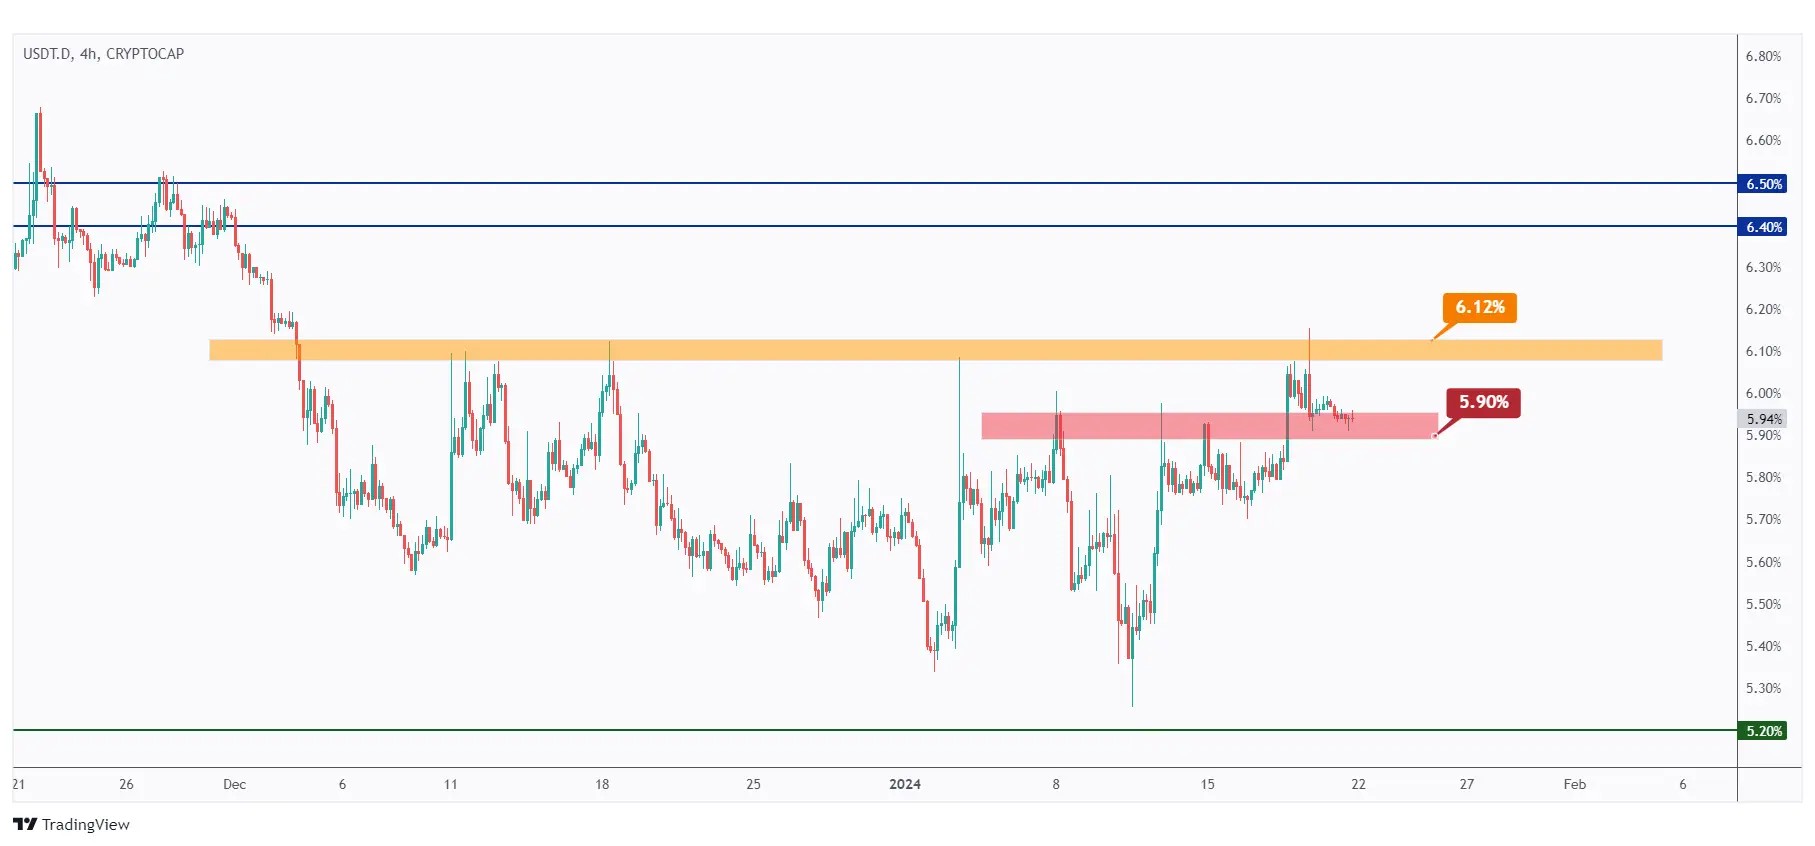
In the 4-hour timeframe, the overall bias remains bullish from a short-term perspective.
For the bulls to establish dominance from a medium-term perspective, a breakout above 6.12% is necessary.
In parallel, if the previous local support at 5.9% is breached downward, we anticipate short-term bearish control, potentially pushing USDT.D back to the lower boundary of the range.
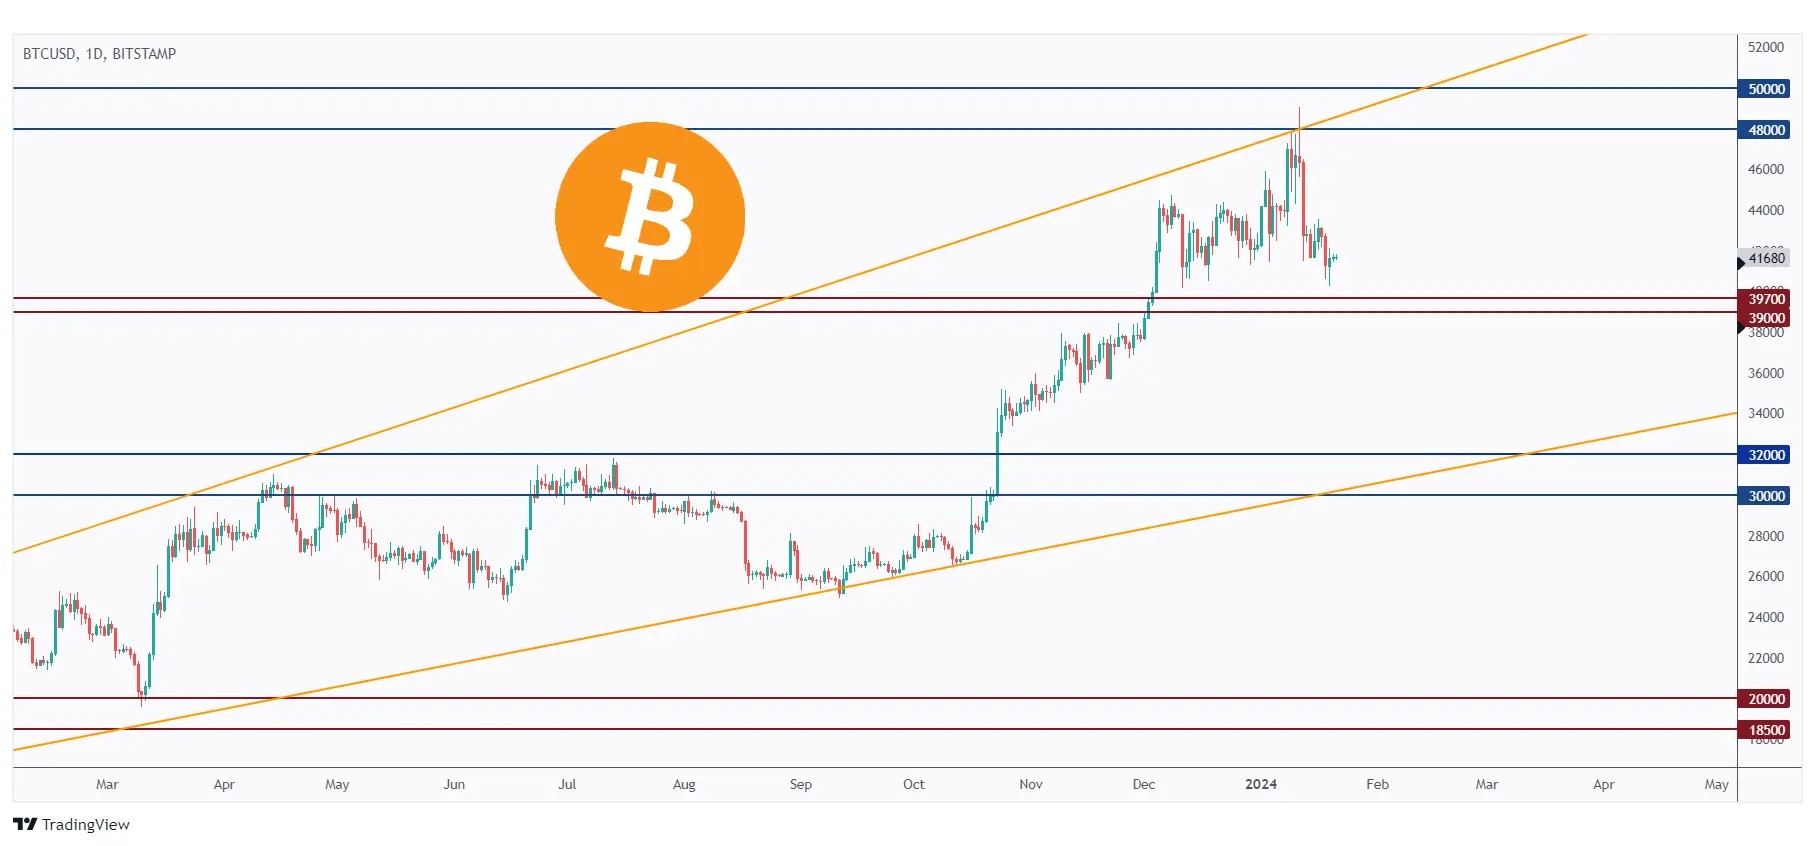
BTC is currently trading within a range defined by our $39,000 support and $50,000 resistance levels.
As BTC approaches the support zone, we will be actively looking for buy setups on lower timeframes.
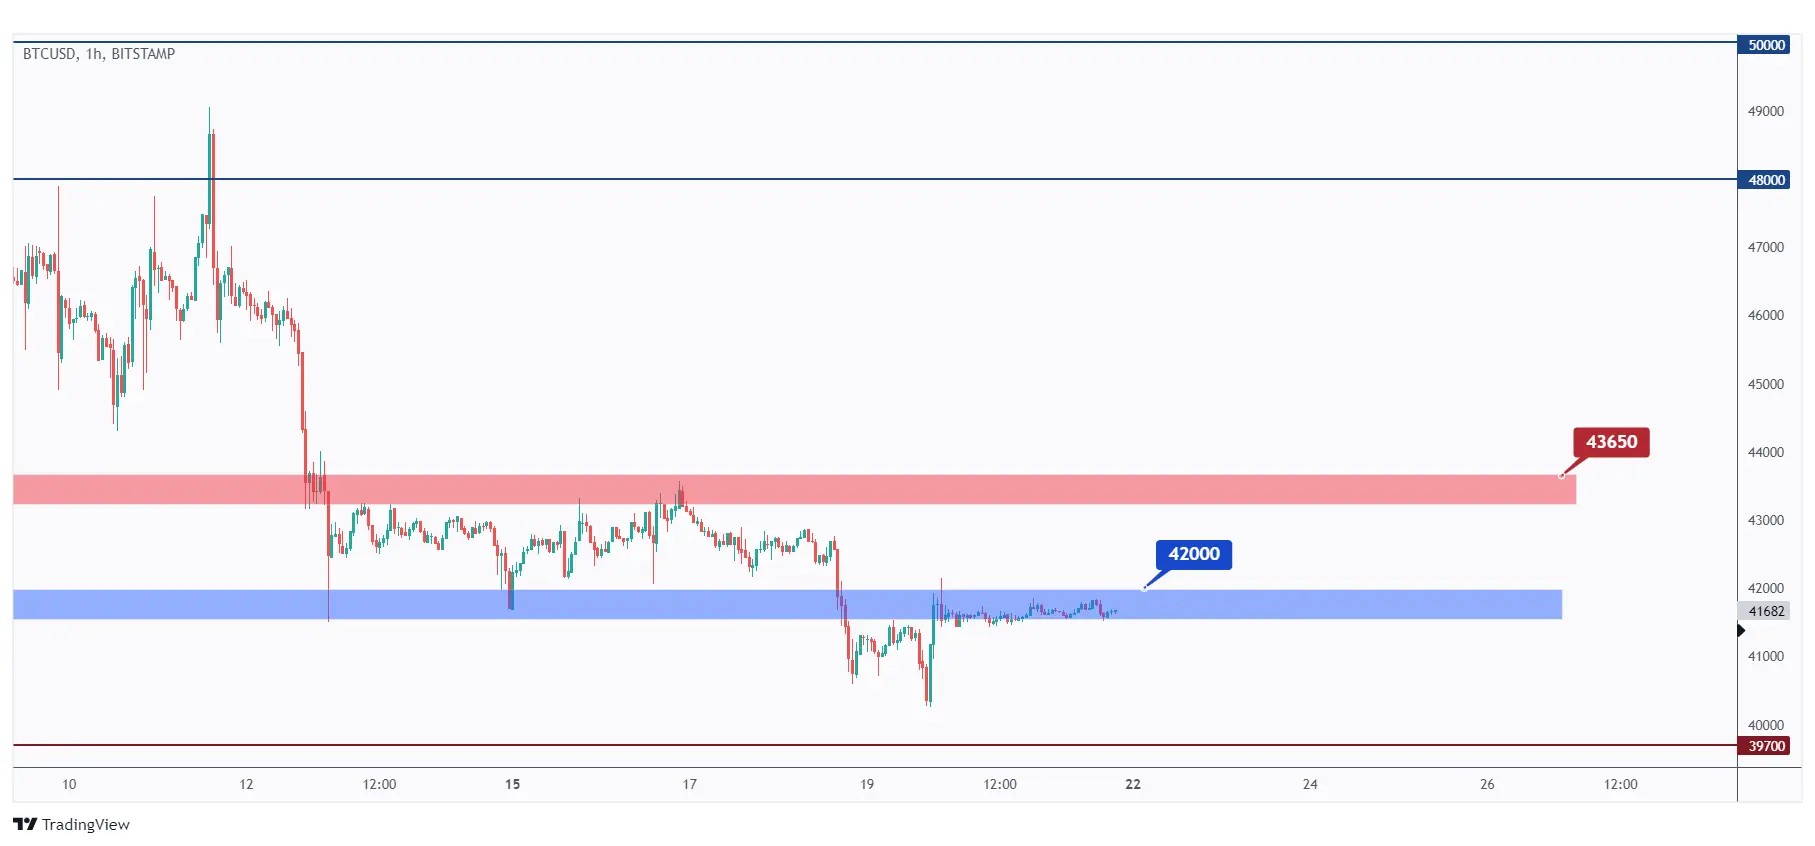
In the 1-hour timeframe, for the bulls to regain control from a short-term perspective, a breakout above the $42,000 previous high marked in blue is essential. In such a scenario, an anticipated movement towards the $43,650 previous major high would be expected.
Meanwhile, BTC could maintain a bearish stance and potentially test the $40,000 support and round number.
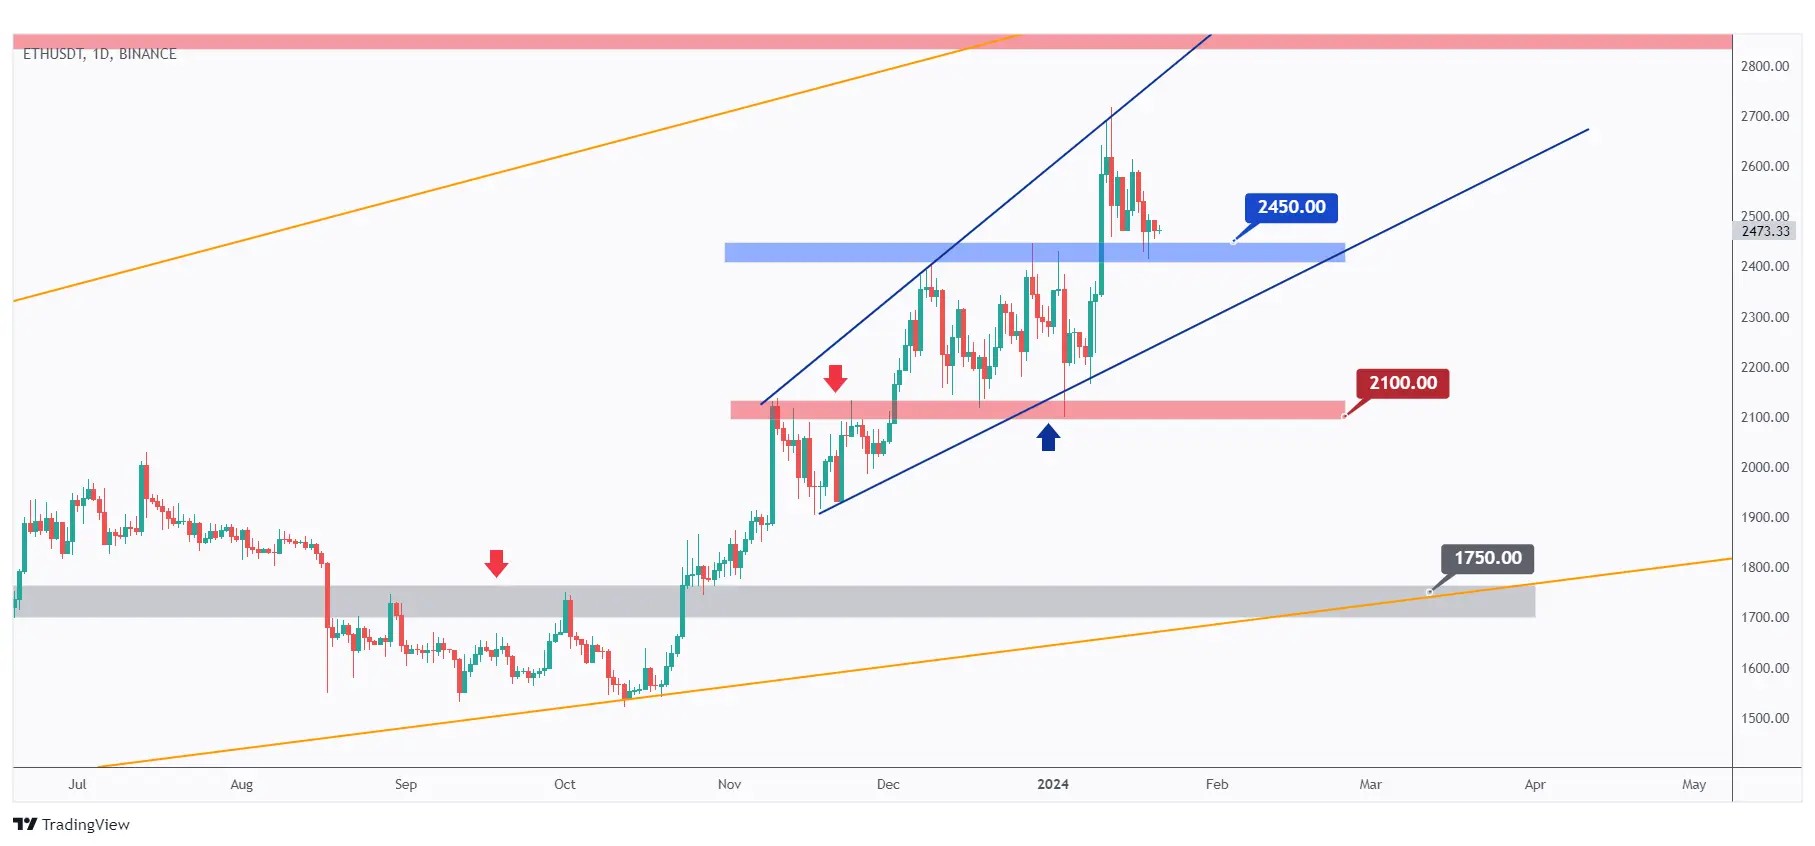
After facing rejection at the upper bound of the blue wedge pattern, ETH has entered a correction phase and is currently approaching a robust support zone at $2450.
As long as the support holds, we will be actively seeking trend-following buy setups on lower timeframes.
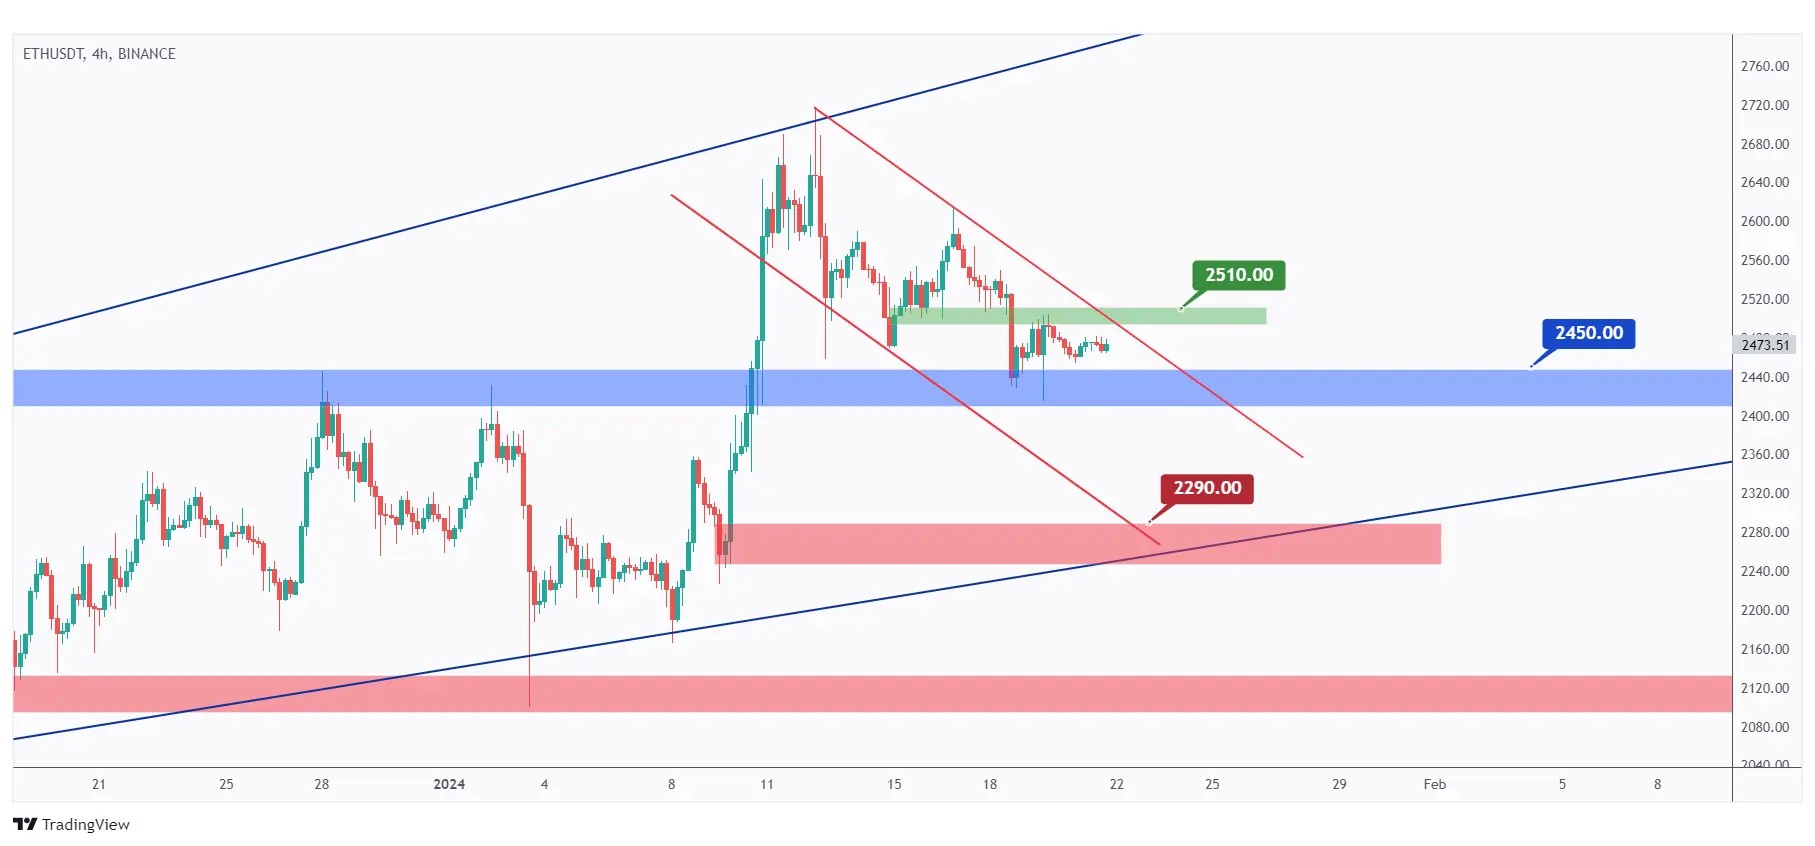
In the 4-hour timeframe, for the bulls to take over and initiate the next upward impulse movement, a breakout above the last minor high at $2510 is necessary.
In the meantime, ETH could remain bearish and potentially test the $2450 support or even break it downward.
Quotes / Advices
In trading, distinguish it from gambling by embracing strategy.
Prioritize risk management; set clear entry and exit points to control losses.
Diversify your portfolio to spread risk across assets.
Continuous learning is essential; stay updated on trading strategies and trends.
Successful trading demands skill, knowledge, and a patient, calculated mindset—setting it apart from the unpredictability of gambling.
Closing Remarks
In summary, the crypto market heatmap reveals a consolidation of BTC around $42,000 after two bearish weeks, with most altcoins showing modest bullish momentum.
The Fear & Greed Index remains in 'Greed' despite recent market fluctuations, indicating trader optimism ahead of Bitcoin's Halving.
The US500 index is bullish, attempting to break its all-time high at $4825, while the DXY (USD Index) shows a shift to bullish momentum.
Gold is expected to continue a bullish trend if it holds support at $2000.
USDT.D indicates a bullish bias, and BTC and ETH are trading within defined ranges, with potential buy setups on lower timeframes.
ETH faces a correction but remains bullish if support at $2450 holds.