
elcome to another crypto market outlook for the 16th of January!
In today's market analysis, we will delve into the current state of the cryptocurrency market. BTC faced rejection at the $48,000 mark, and USDT.D is hovering around a resistance zone.
Furthermore, we will cover five altcoins (BCH, LDO, INJ, RNDR, and YFI), emphasizing their key levels and potential trading setups.
Are you ready?
Today, we will cover the following topics:
- USDT.D and BTC Analysis
- 5 Altcoins Analysis
- Quotes / Advices
- Closing Remarks
USDT.D and BTC analysis
As usual, I always start my analysis with USDT.D as it serves as an indicator of traders' sentiment. USDT.D reflects whether traders are optimistic (investing in cryptocurrencies) or pessimistic (shifting towards stablecoins).
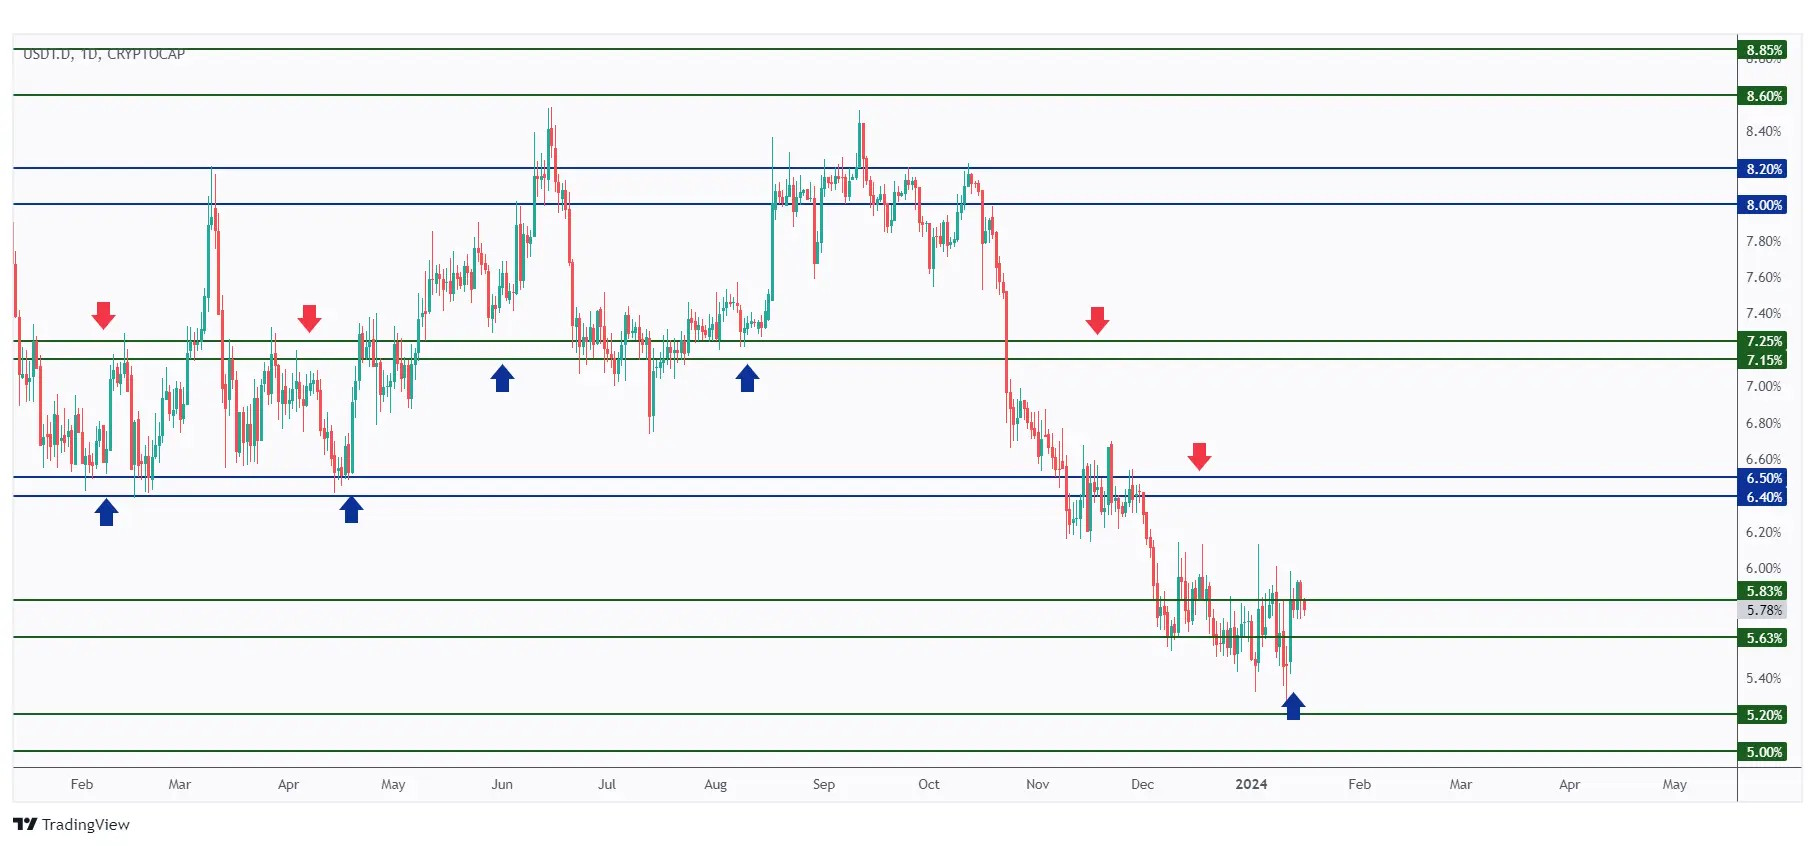
USDT.D is currently consolidating within a strong resistance zone.
As long as the resistance persists, we anticipate a bearish movement, which could positively impact the overall sentiment in the crypto market.
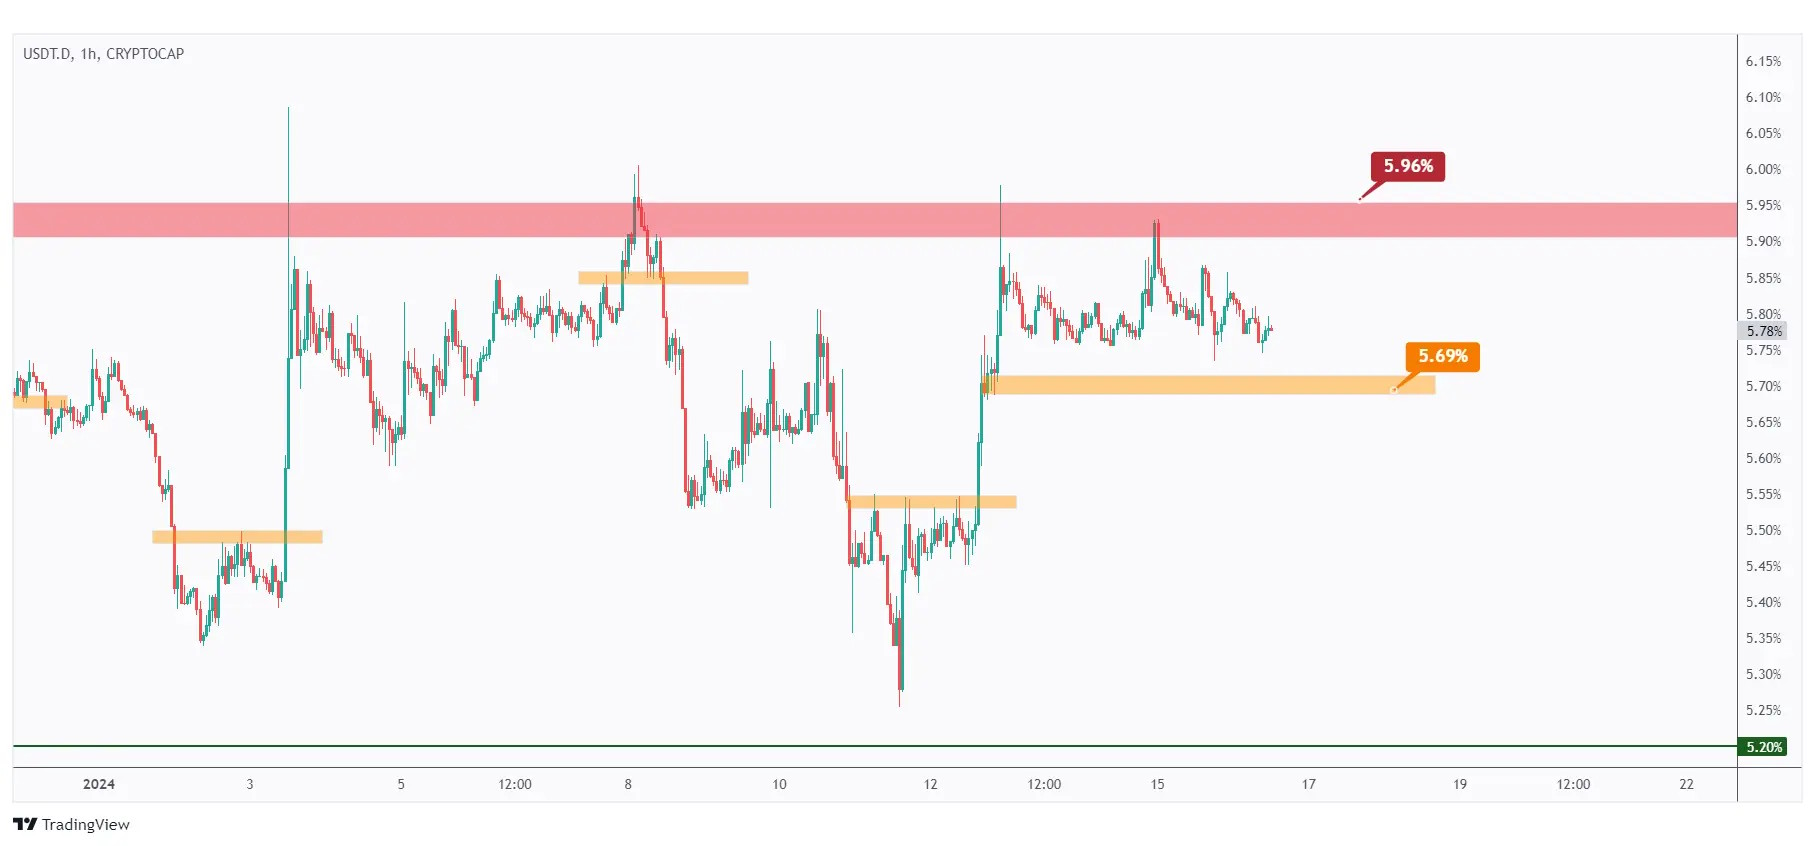
In the 1-hour timeframe, USDT.D has been hovering near the upper boundary of the range. To establish bearish control once again, a break below the last minor low marked in orange at 5.69% is necessary.
In parallel, for the bulls to assume control and signal the beginning of an uptrend, a breakout above 5.96% is required.
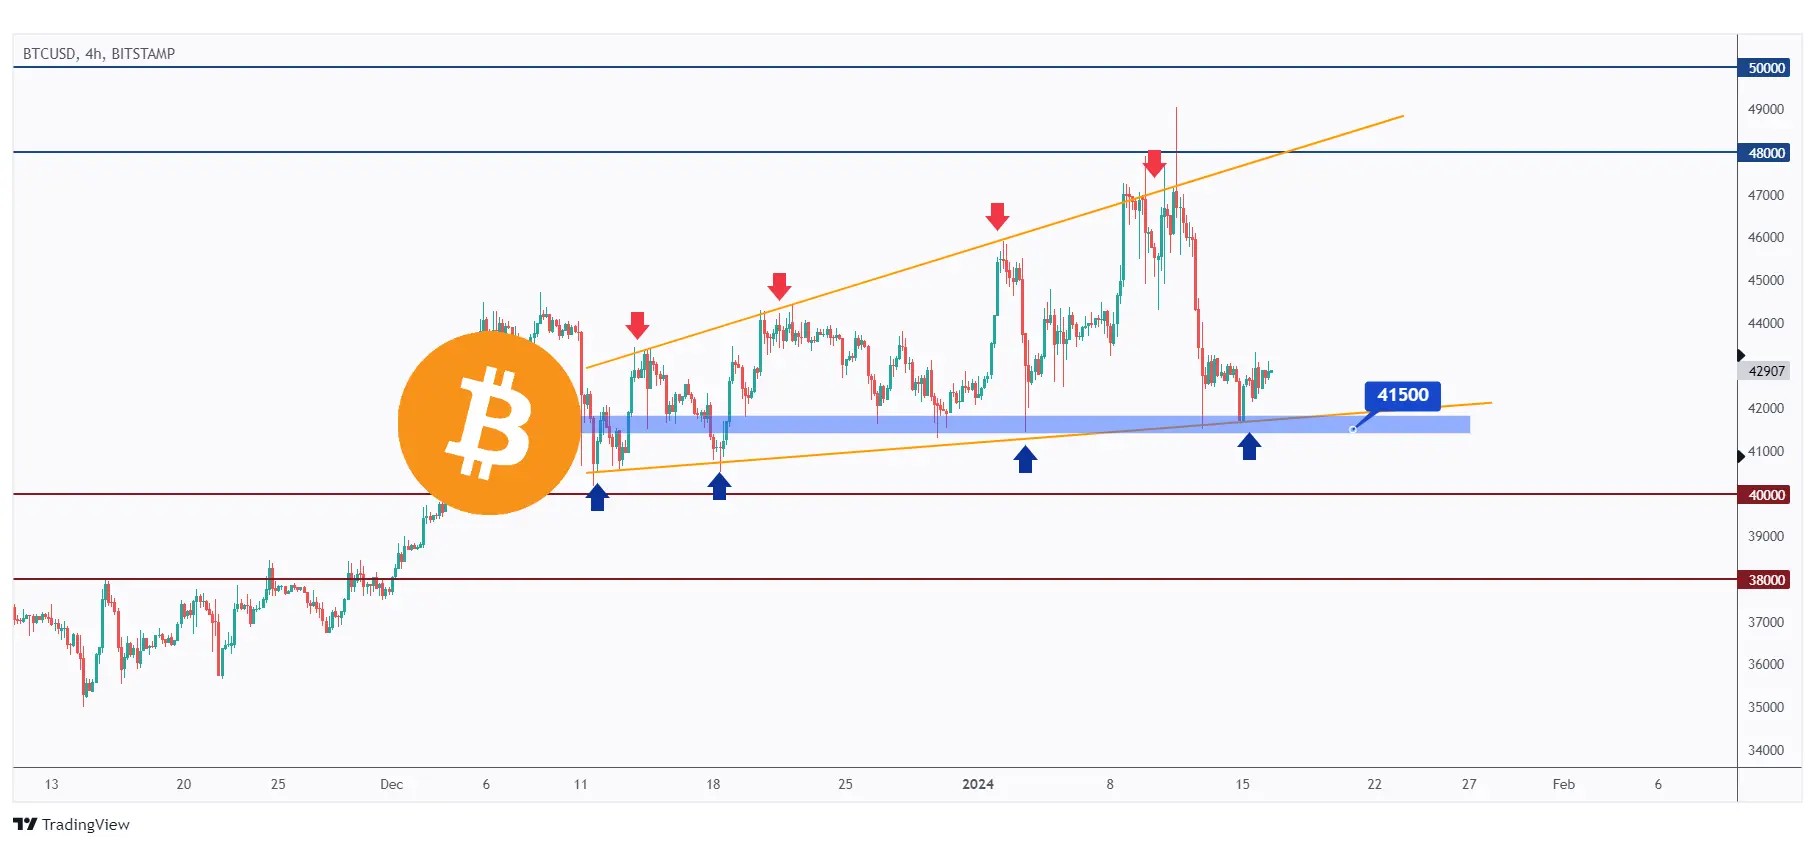
After being rejected by the $48,000 resistance zone, BTC experienced a decline and is currently positioned near the lower boundary of the orange wedge pattern.
As long as the $41,500 support holds, we will be on the lookout for trend-following buy setups on lower timeframes.
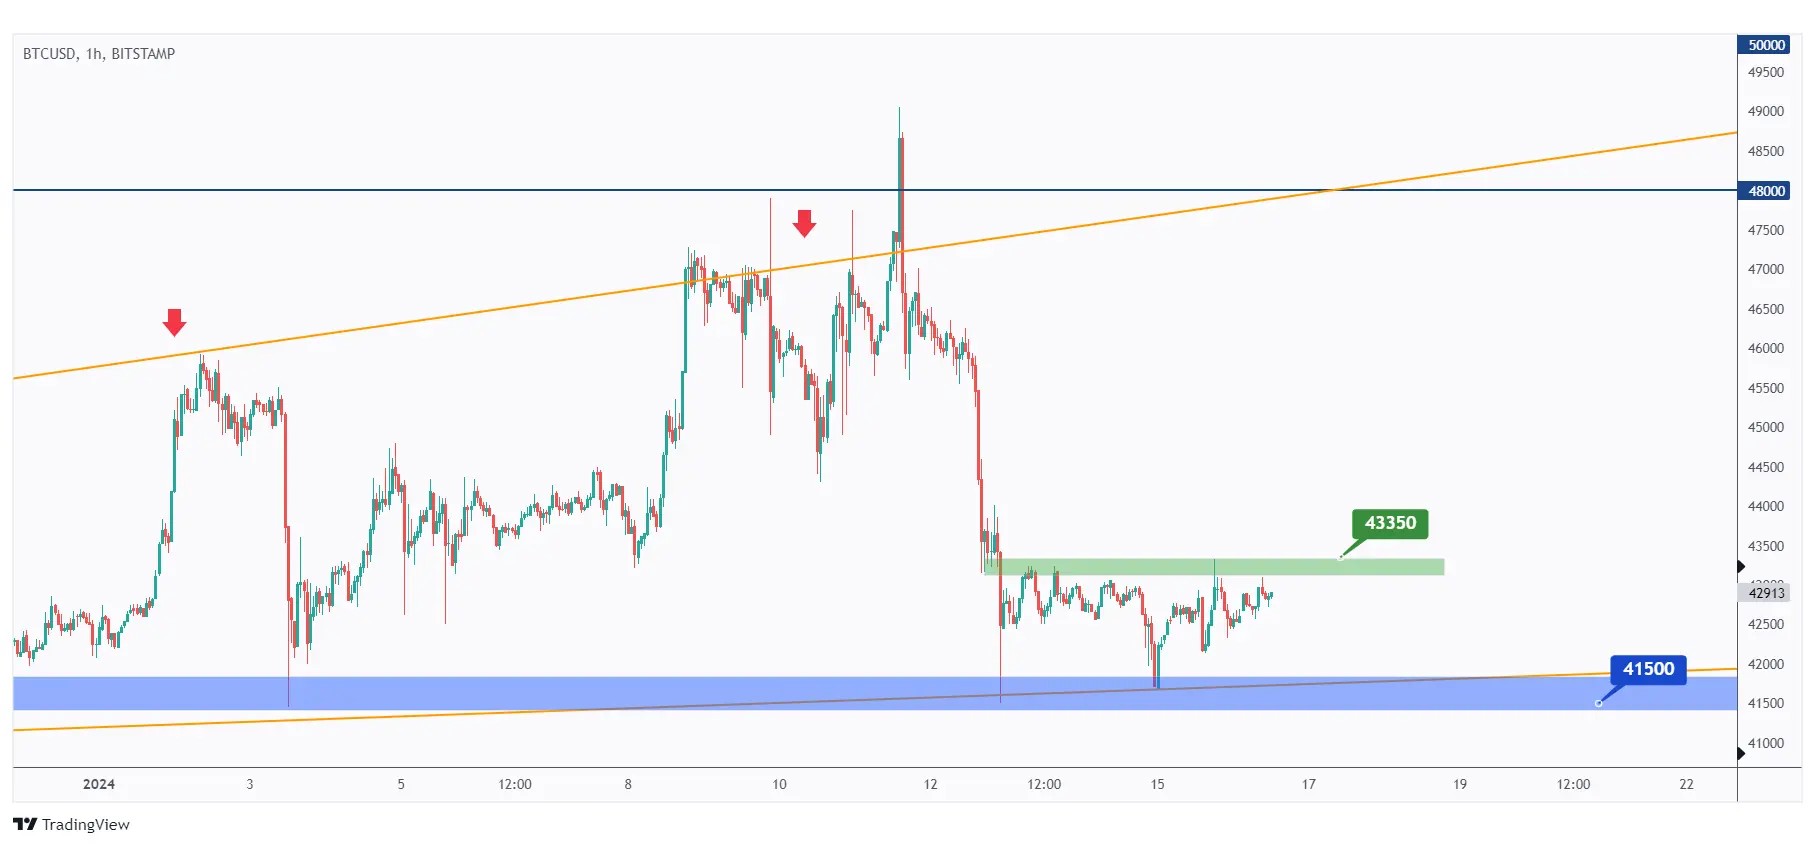
For the bulls to assume control and initiate the next bullish impulse, a momentum candle close above the last high marked in green at $43,350 is required.
In this scenario, a movement towards the $48,000 - $50,000 range would be expected.
5 Altcoins Analysis
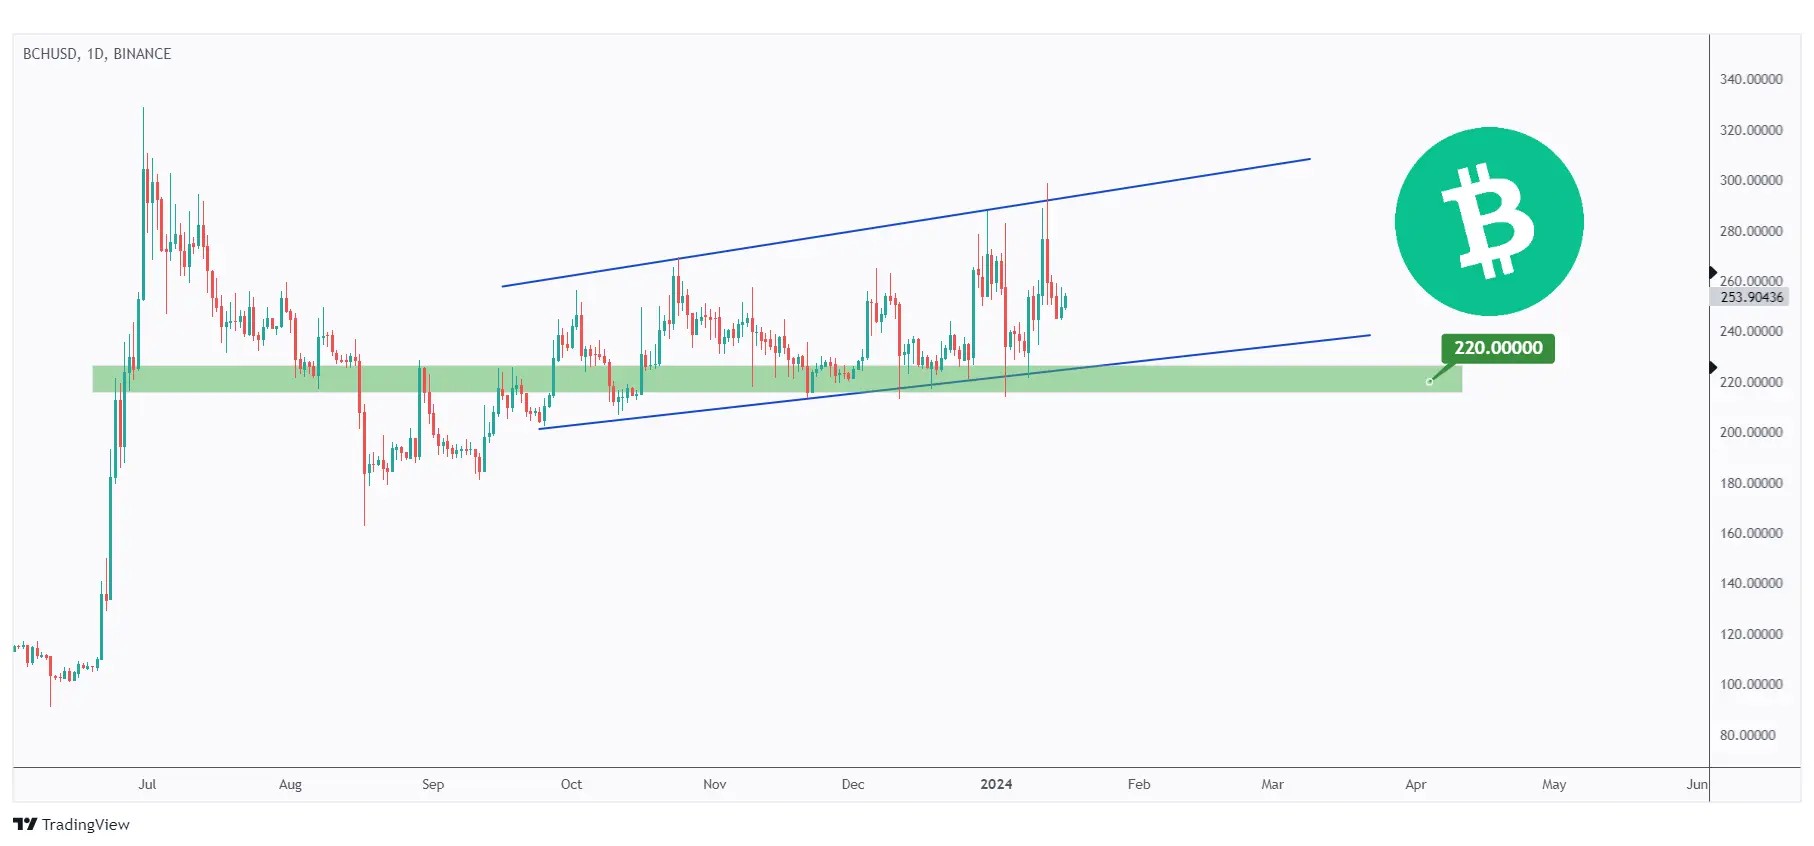
Let's start with BCH. In accordance with our analysis from last week, BCH rejected the $220 support and moved higher, reaching our target at $300.
Currently, as BCH retraces to retest the lower boundary of the blue channel and the $220 support once again, we will be searching for new buy setups on lower timeframes.
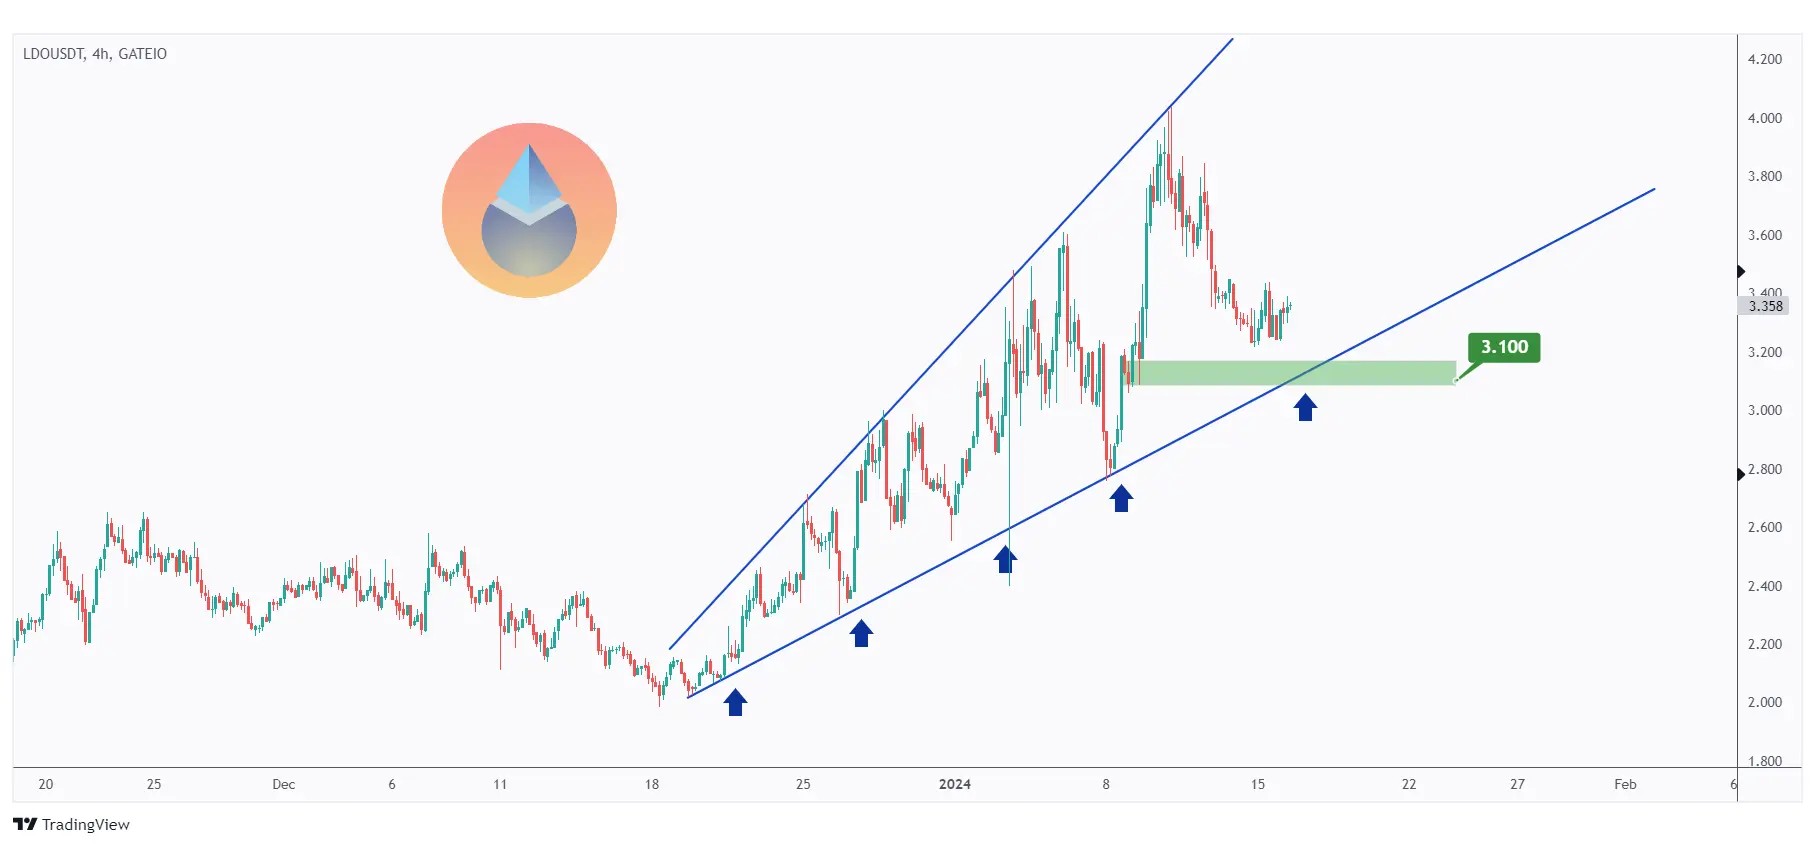
Turning our focus to LDO, this specific altcoin has displayed an overall bullish trend, trading within the confines of a rising broadening wedge outlined in blue.
Presently, LDO is undergoing a retest of the lower blue trendline. Thus, we will be looking for trend-following buy setups on lower timeframes.
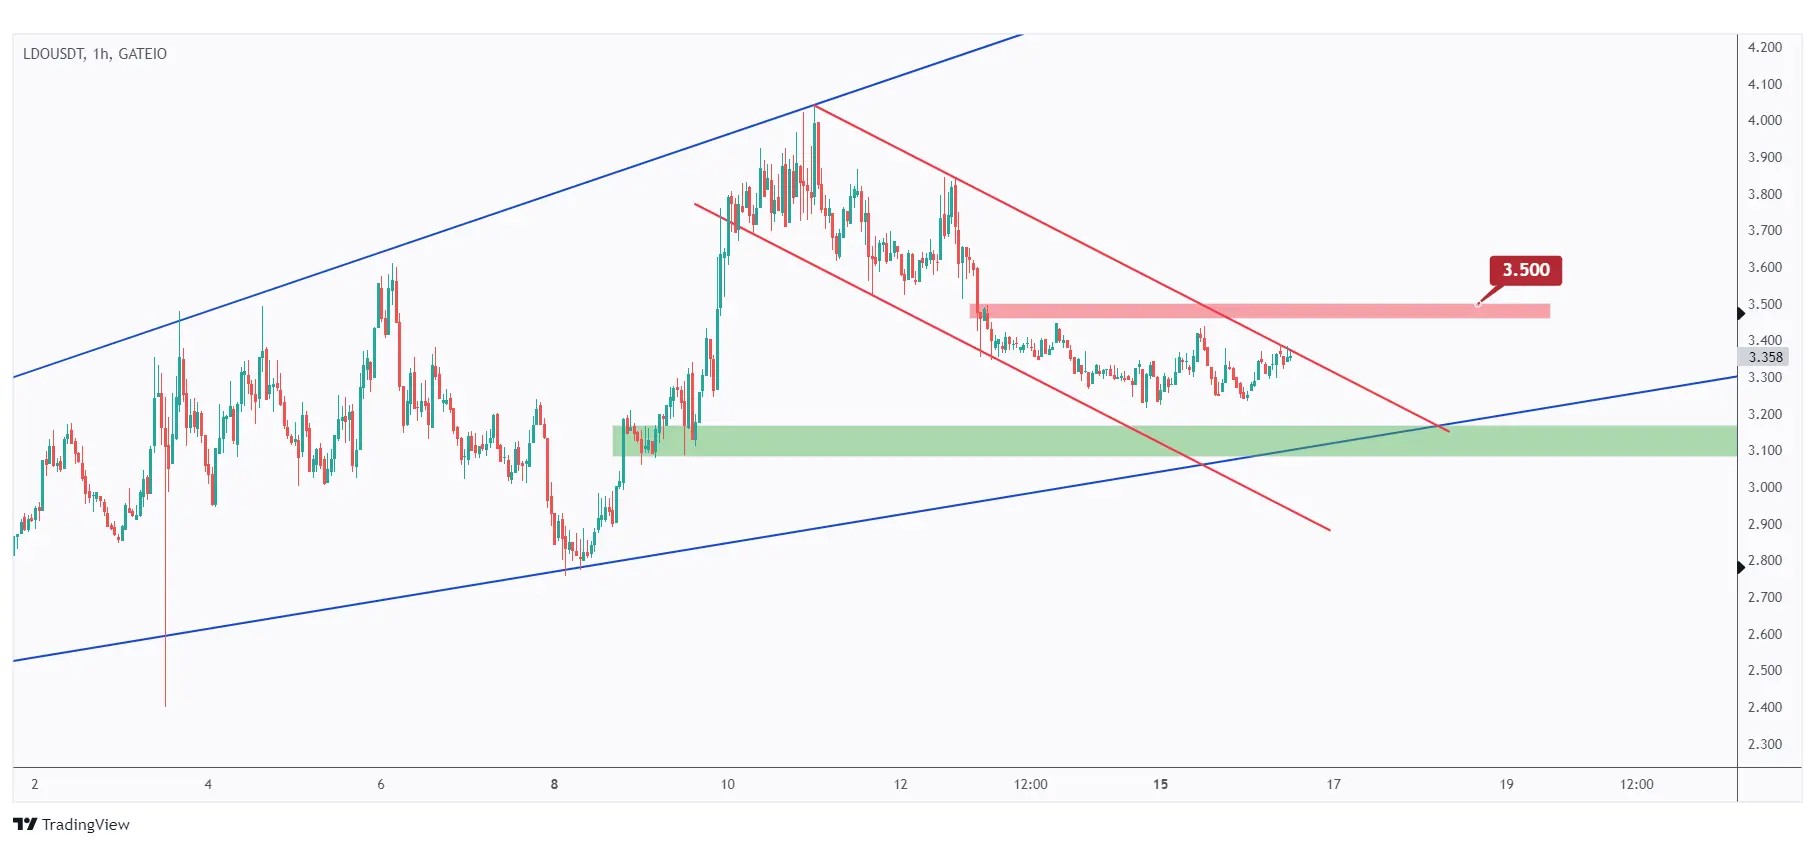
In the 1-hour timeframe, for the bulls to establish control, a momentum candle close above the last major high highlighted in red at $3.5 is necessary.
In this scenario, a movement towards the $4 resistance would be expected.
Meanwhile, LDO could remain bearish and potentially continue to trade lower.
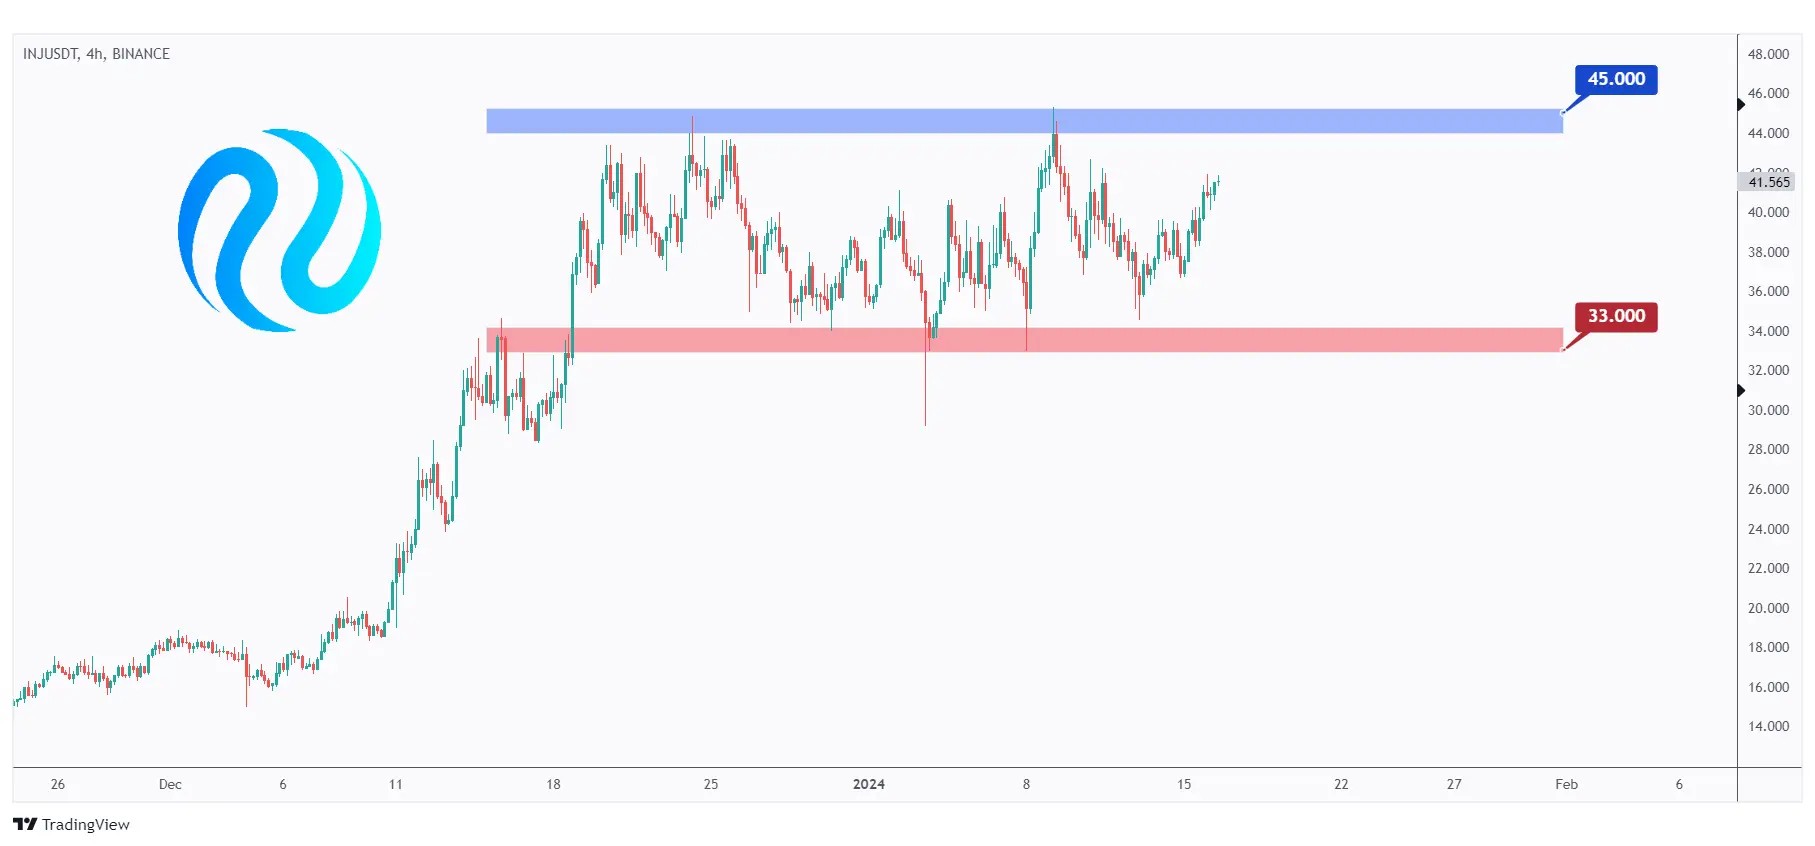
Next on the list for today, we have INJ. It has exhibited a flat trend, trading within a narrow range between $33 and $45.
As INJ approaches the $45 support zone, we will be actively searching for potential buy setups on lower timeframes.
In parallel, for the bulls to assume control from a long-term perspective, a momentum candle close above $45 is needed.
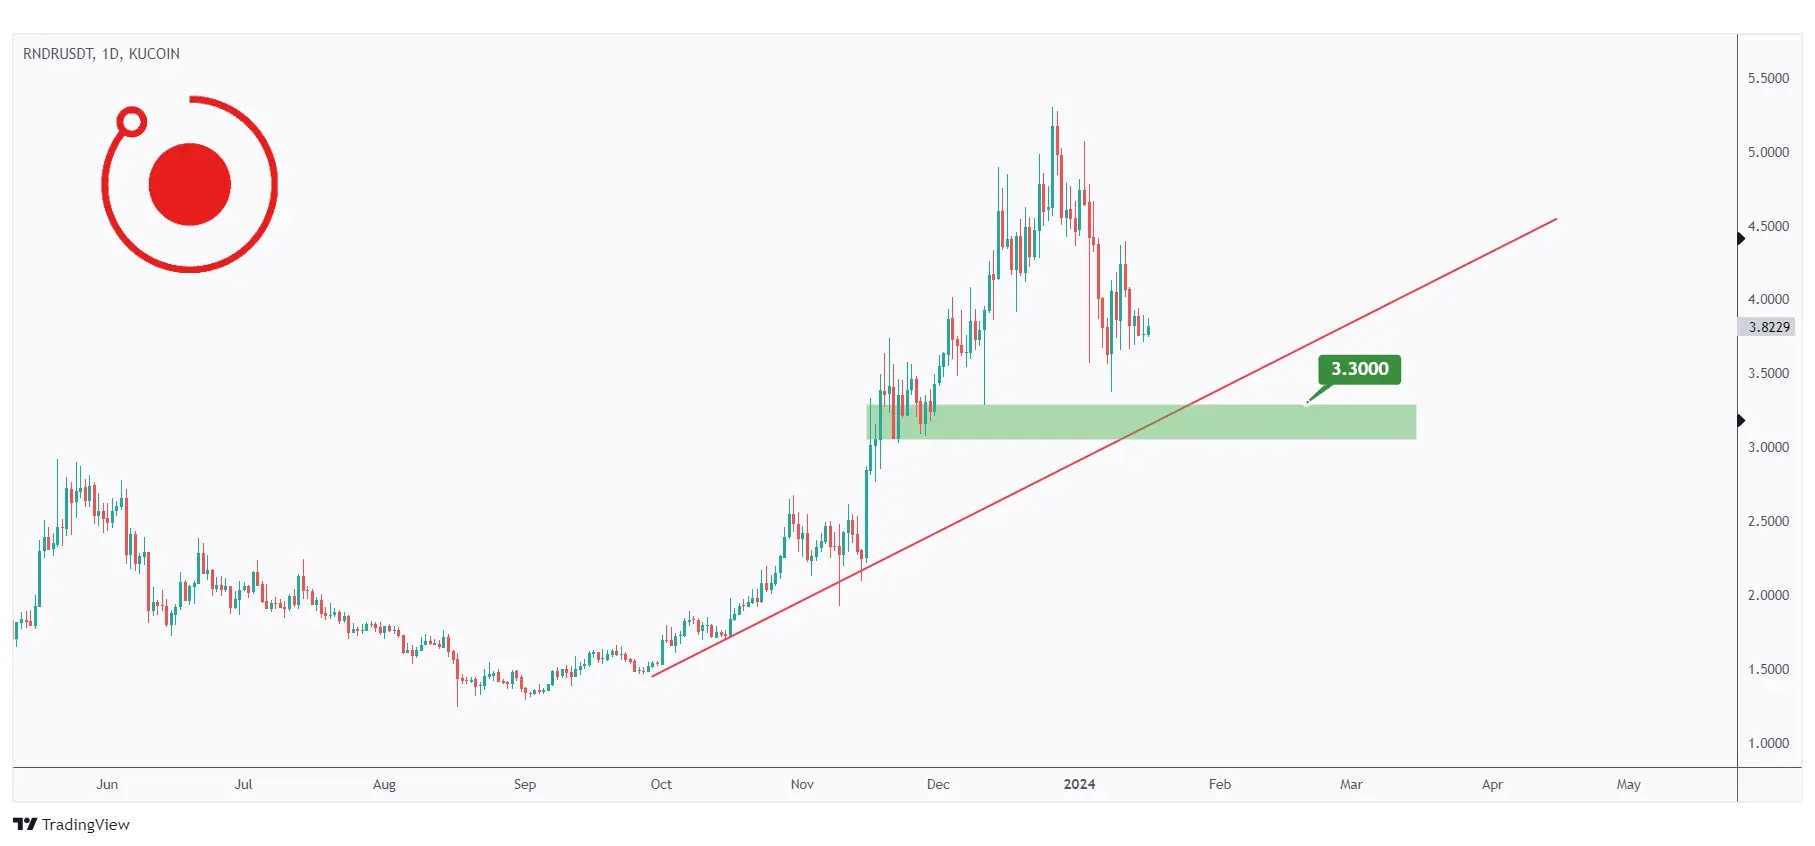
Analyzing RNDR, it has generally shown a bullish trend, trading above the red trendline.
At present, RNDR is undergoing a correction zone and nearing a robust demand zone highlighted in green.
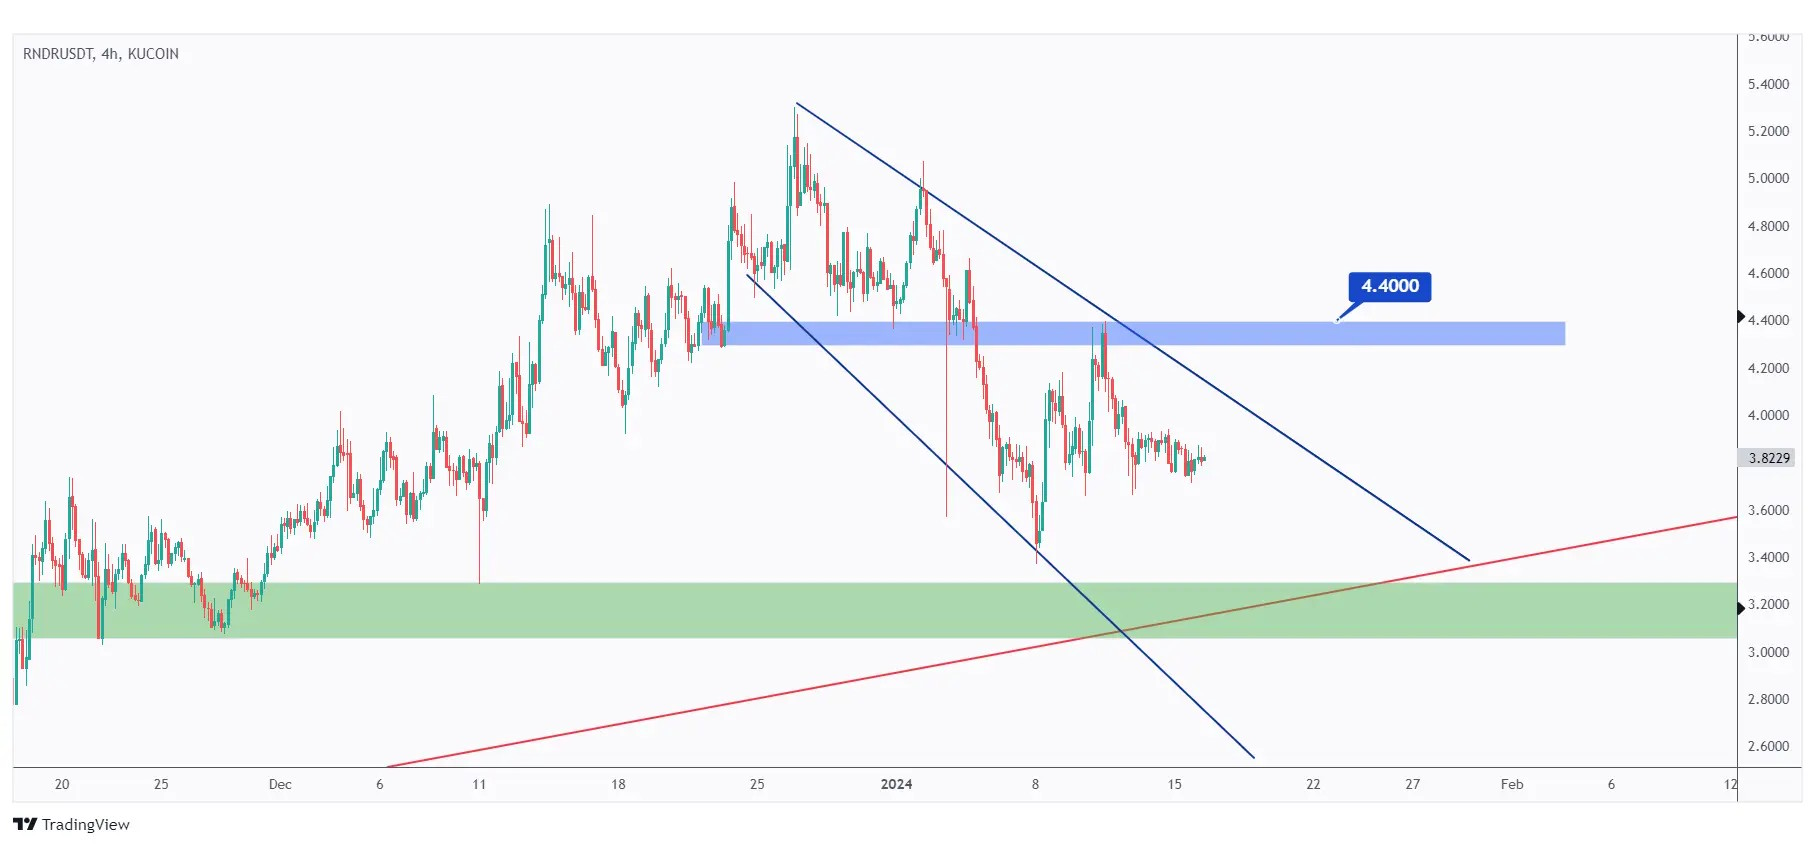
Examining the 4-hour timeframe for RNDR , it's apparent that bearish momentum prevails, as it is trading inside the falling channel in blue.
For the bulls to assume control and initiate the next upward impulse movement, a breakout above the last major high at $4.4 is necessary.
Meanwhile, RNDR could remain bearish and potentially continue trading lower to test the daily demand zone.
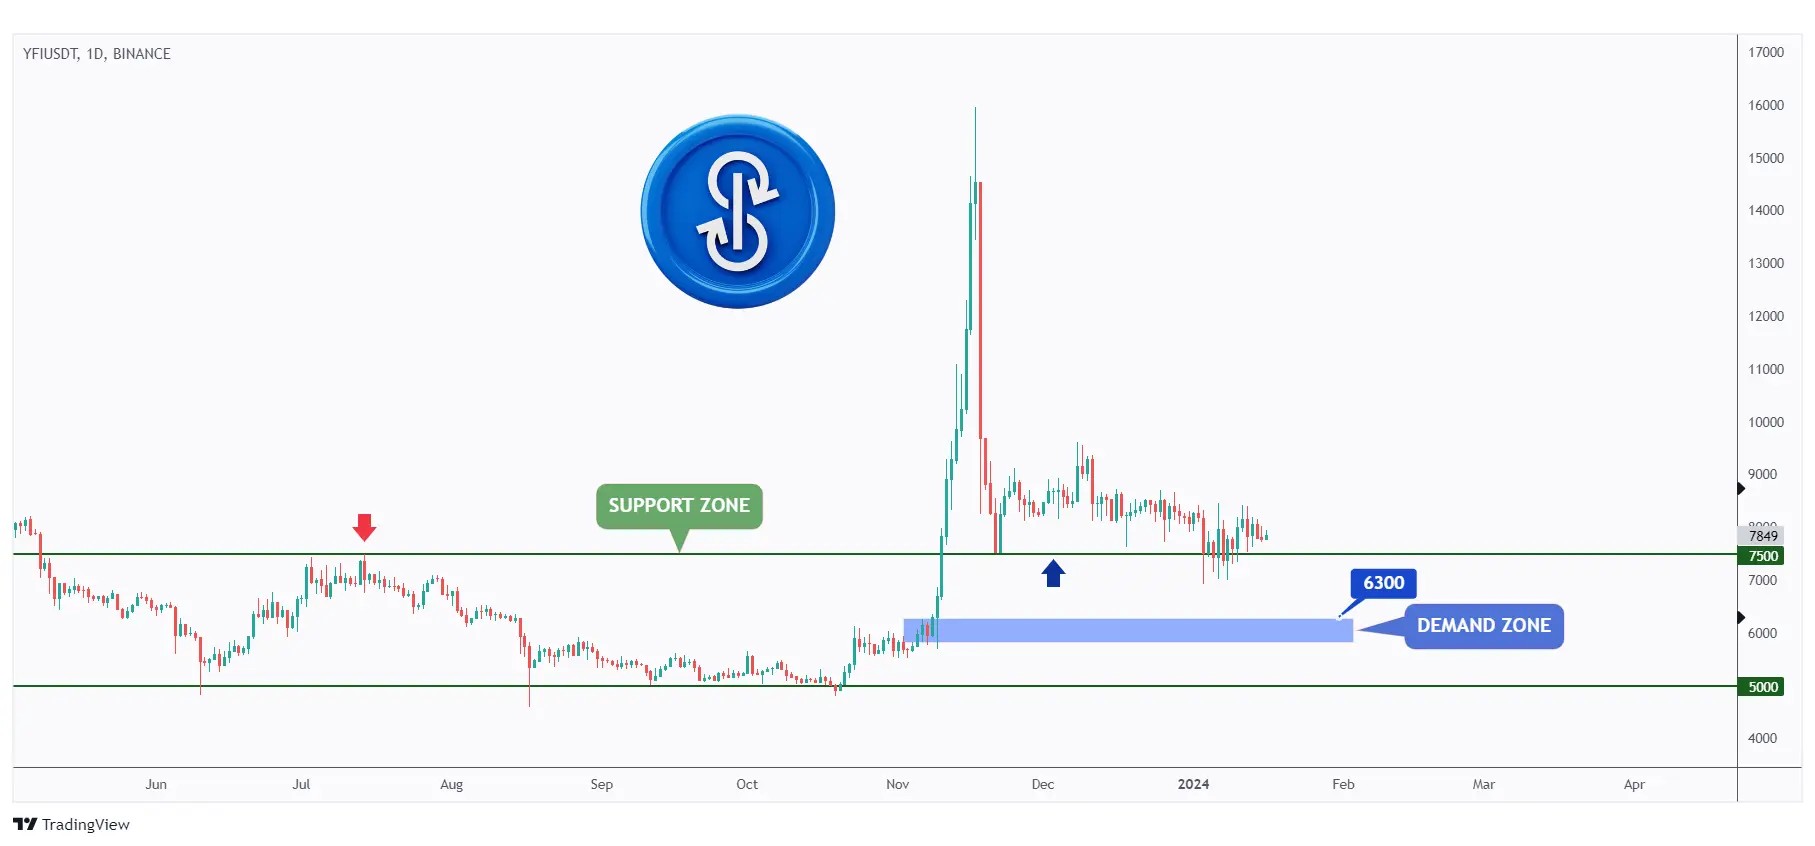
After rejecting the $7500 support, YFI has been consolidating within a narrow range.
If the $7500 support is breached downward, a movement towards the $6300 demand zone can be anticipated.
Meanwhile, as long as the support holds, we will be actively looking for buy setups.
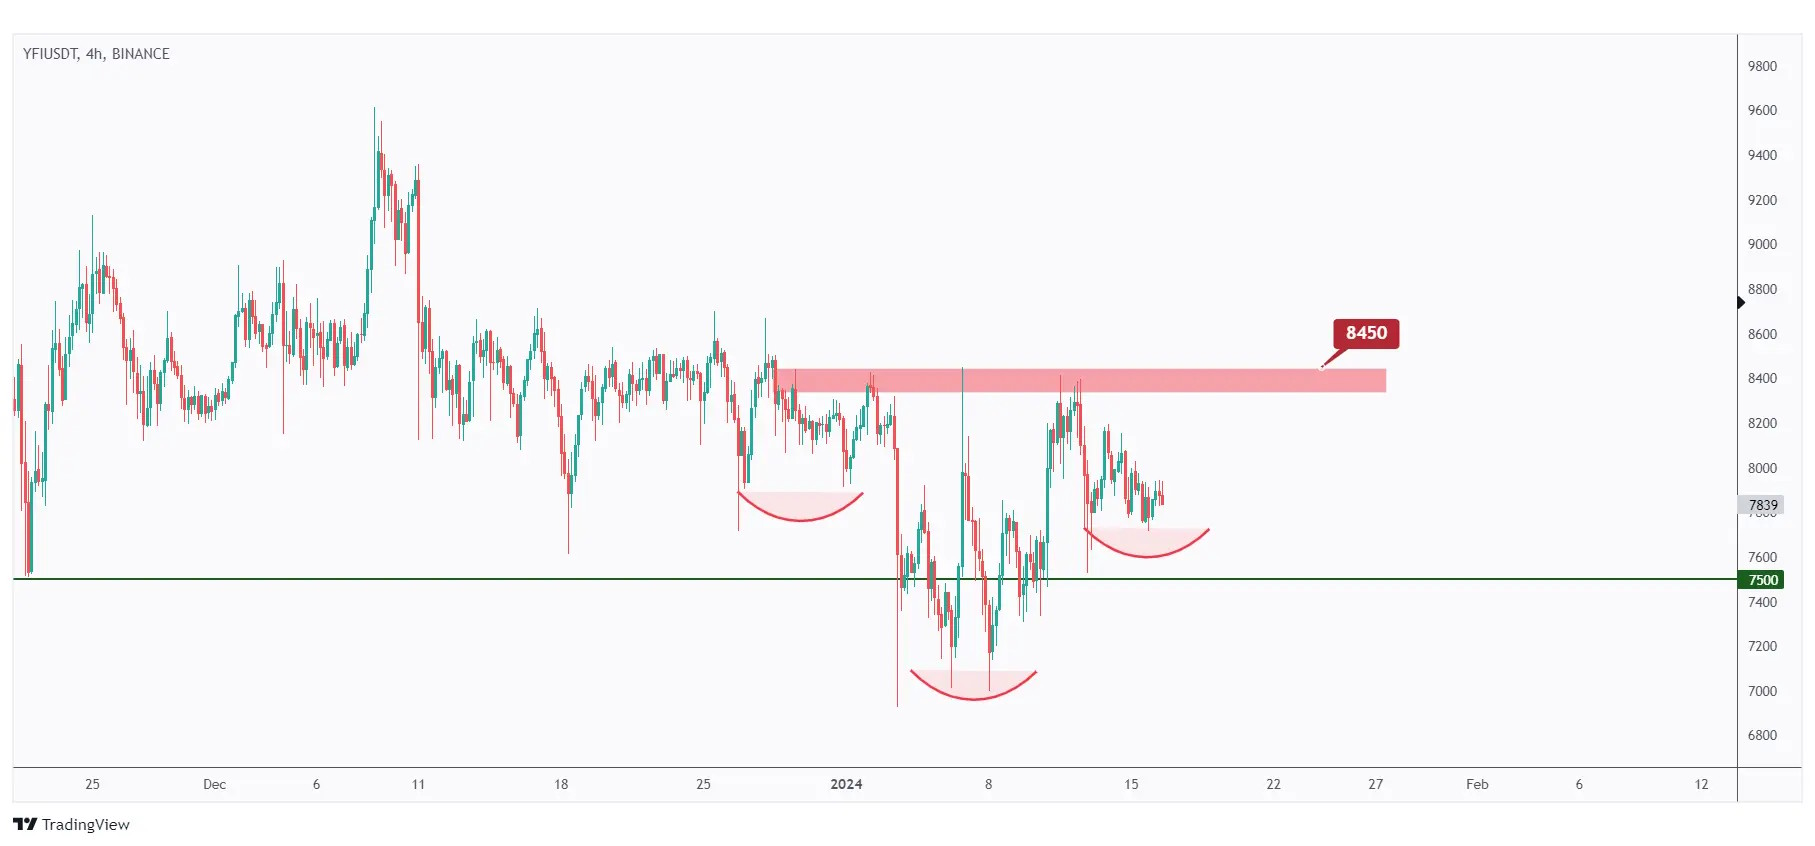
For the bulls to assume control once more and initiate the next upward impulse movement, a momentum candle close above the neckline of the inverse head and shoulders, marked in red at $8450, is required.
Quotes / Advices
5 tips for trading sessions:
- Understand the operating hours of the market you are trading in. Major financial markets include the New York, London, and Tokyo.
- Trade during peak hours for higher liquidity and tighter bid-ask spreads.
- Stay informed about economic events and releases scheduled during trading sessions.
- Adapt your trading strategies based on the characteristics of the specific trading session.
- Apply sound risk management principles, such as setting stop-loss orders, diversifying your portfolio, and avoiding risking more than you can afford to lose.
Closing Remarks
In summary, the outlook begins with a focus on USDT.D, representing traders' sentiment, currently consolidating within a strong resistance zone. A break below 5.69% is anticipated for a bearish movement, impacting overall market sentiment.
In BTC analysis, the coin faces a decline near the $41,500 support, with potential bullish momentum above $43,350.
Five altcoins are then analyzed:
BCH: After rejecting $220 support, BCH reached the target at $300. Retracing to retest support, buy setups are sought on lower timeframes.
LDO: Trading in a rising broadening wedge, LDO undergoes a retest of the lower trendline. A bullish move above $3.5 is crucial for further gains.
INJ: Trading within $33-$45 range, INJ is examined as it approaches the $45 support zone for potential buy setups.
RNDR: Displaying a bullish trend but currently in a correction zone, RNDR needs to break above $4.4 for upward momentum.
YFI: Consolidating after rejecting $7500 support, YFI's upward move requires a close above the inverse head and shoulders neckline at $8450.